Fig. 14
Download original image
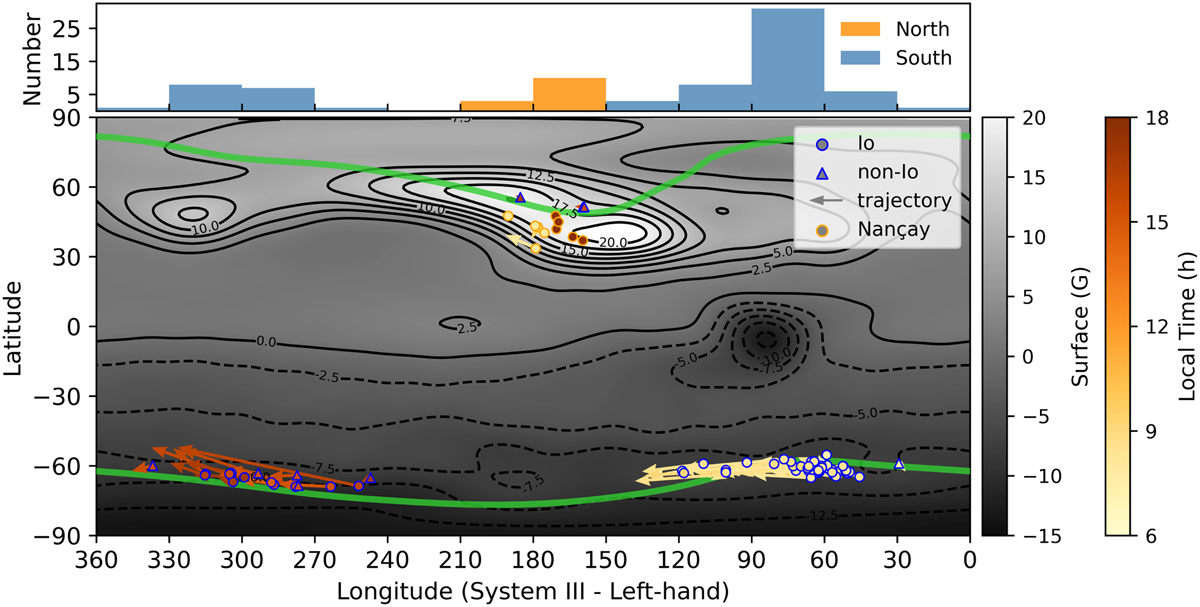
Statistically projected location of the DAM sources in longitude and latitude. The dotted and triangular markers show the median locations of the starting footprints of active field lines for Io and non-Io events, respectively. The color-coded arrows indicate the trajectory of the footprints. The dots with orange edges represent the Io-related events observed by the NDA. The yellow-to-brown color bar indicates the local time of the source locations, reflecting whether the emissions are on the dawn or dusk side of the Sun’s view. The histogram at the top indicates the distribution of longitude averages in the source region in 30° bins.
Current usage metrics show cumulative count of Article Views (full-text article views including HTML views, PDF and ePub downloads, according to the available data) and Abstracts Views on Vision4Press platform.
Data correspond to usage on the plateform after 2015. The current usage metrics is available 48-96 hours after online publication and is updated daily on week days.
Initial download of the metrics may take a while.