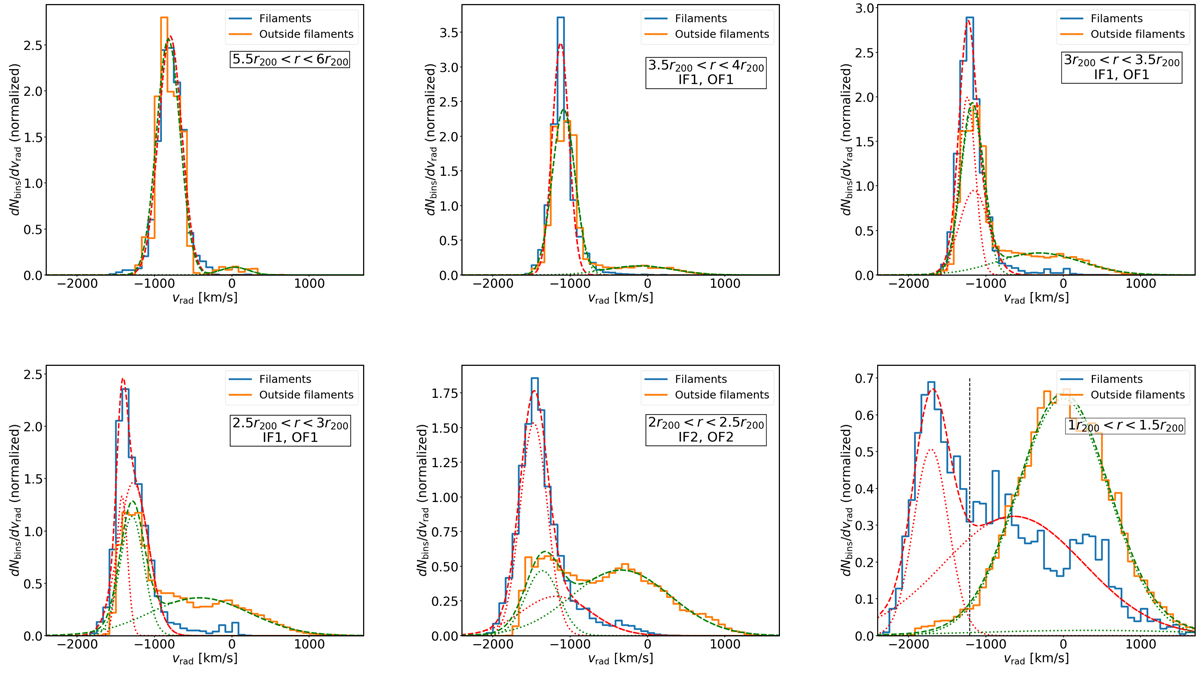
Fig. 8.
Download original image
Radial velocity distributions within (blue line) and outside (orange line) filaments at different radial distances from the cluster centre. The distance is decreasing from left to right and top to bottom as indicated in the panels. The dashed red and green curves show double Gaussian fits to the radial velocity distributions within and outside filaments, respectively. The individual Gaussian components of the fits are shown by dotted lines. The vertical dashed black line on the bottom right panel shows vff/2 at 1.25r200; within filaments, approximately half of the gas (by mass) retains radial velocities vrad < vff/2 at r200 < r < 1.5r200.
Current usage metrics show cumulative count of Article Views (full-text article views including HTML views, PDF and ePub downloads, according to the available data) and Abstracts Views on Vision4Press platform.
Data correspond to usage on the plateform after 2015. The current usage metrics is available 48-96 hours after online publication and is updated daily on week days.
Initial download of the metrics may take a while.