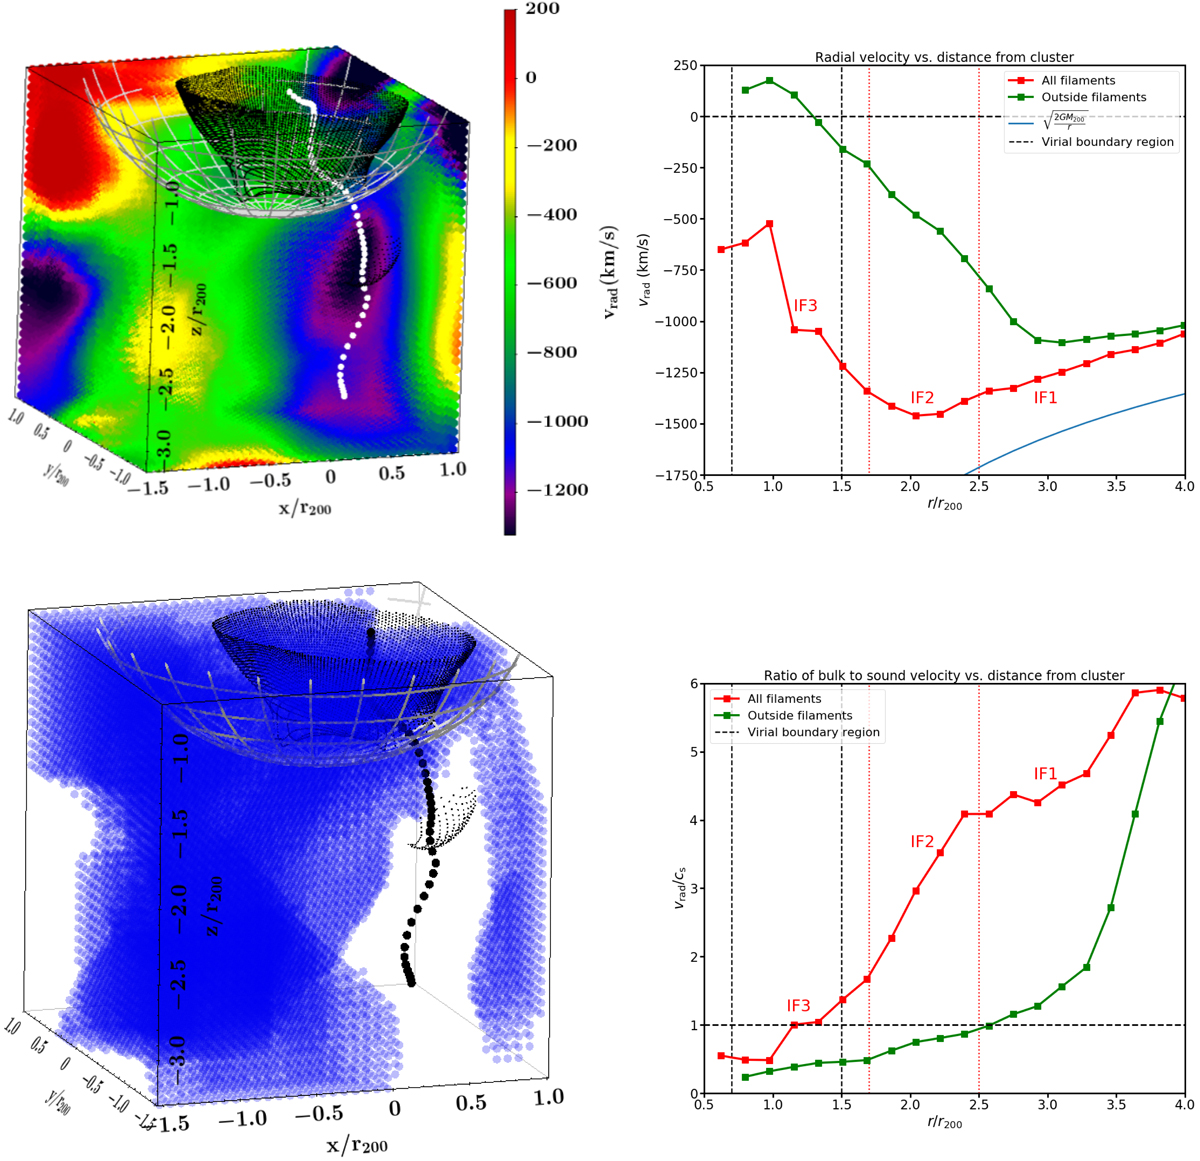
Fig. 7.
Download original image
Radial velocity and Mach number structure in the cluster-filament interface. Top left panel: Radial velocity structure around filament F1 (white dots). Negative (positive) values correspond to gas inflow (outflow). The values are averages in each sight line and thus the image is illustrative rather than quantitatively accurate. The black symbols indicate the boundary of the virial region. The grey surface marks the radius r = 1.5r200 from the cluster centre. Top right panel: Radial velocity repeated from Fig. 5. Bottom left panel: Radial Mach number structure around filament F1 (black dots). The subsonic regions (values below 1) are shown in blue and supersonic regions in white, i.e. in the 2D projection white regions indicate the lack of subsonic gas along the line of sight. Bottom right panel: Median ratio of bulk to sound velocity (a proxy for Mach number) of the gas outside the virial boundary as a function of distance from the cluster centre.
Current usage metrics show cumulative count of Article Views (full-text article views including HTML views, PDF and ePub downloads, according to the available data) and Abstracts Views on Vision4Press platform.
Data correspond to usage on the plateform after 2015. The current usage metrics is available 48-96 hours after online publication and is updated daily on week days.
Initial download of the metrics may take a while.