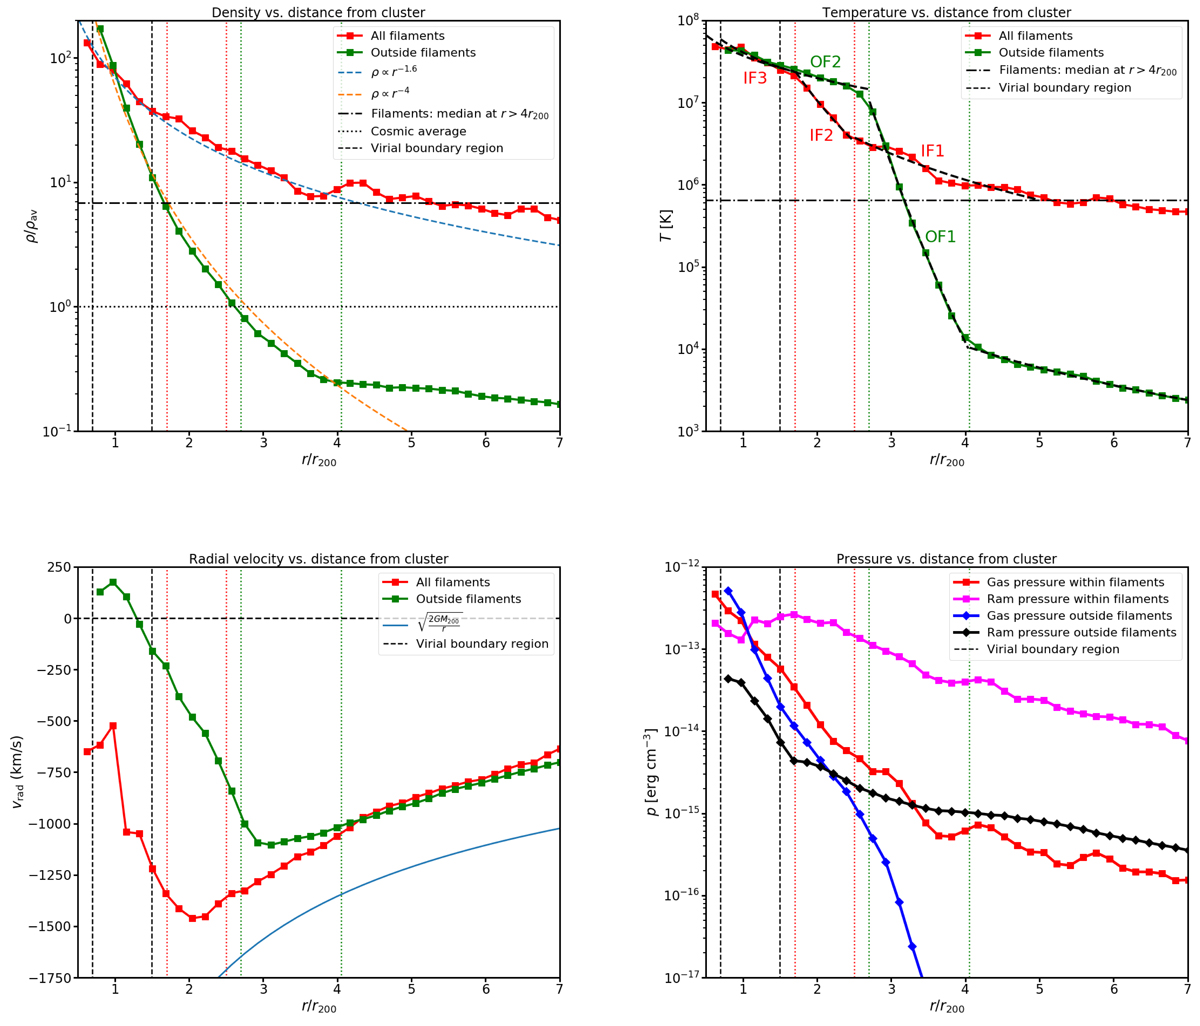
Fig. 5.
Download original image
Dependences of various physical quantities on distance from the cluster center. Top left panel: Median overdensity of the gas outside the virial boundary of the cluster inside (red symbols) and outside (green symbols) the filaments. The dashed blue (orange) line shows ρ ∝ r−1.6 (ρ ∝ r−4) approximation for the density profile inside (outside) filaments. The horizontal dash-dotted line shows the median overdensity within the filaments at radii 4r200 < r < 7r200. The mean cosmic density is denoted with a horizontal dotted line. The approximate radial range of the elongated virial boundary is indicated with the vertical dashed lines. Top right panel: Same as left panel, but for the median temperature. The dashed lines indicate the piece-wise power-law approximation to the temperature profile in different zones (IF1-3 and OF1-2, see Sect. 4.2). Bottom left panel: Same as top panels, but for the median radial velocity towards the cluster. The blue curve indicates the free-fall velocity given by the mass of the cluster. Bottom right panel: Median gas and ram pressure outside the virial region of the cluster as a function of the distance from the cluster centre for the gas within (square symbols) and outside (diamond symbols) filaments.
Current usage metrics show cumulative count of Article Views (full-text article views including HTML views, PDF and ePub downloads, according to the available data) and Abstracts Views on Vision4Press platform.
Data correspond to usage on the plateform after 2015. The current usage metrics is available 48-96 hours after online publication and is updated daily on week days.
Initial download of the metrics may take a while.