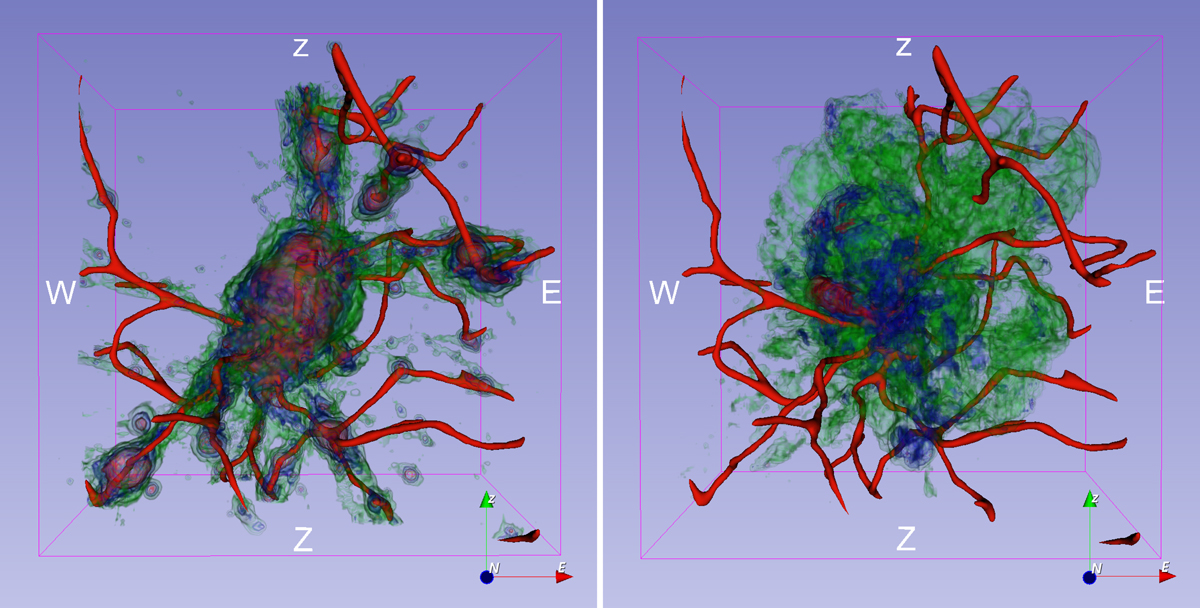
Fig. 4.
Download original image
Density (left) and temperature (right) structure approximately within the cluster-filament interface, i.e. within a ∼(8r200)3 region centred on the cluster CE-29. The filaments spines are indicated in red. In the left panel only regions of gas overdensity above 10 are indicated in order to highlight the connection of the densest infalling gas and the filaments (see the online video showing a 360° view). In the right panel, the green, blue and red surfaces approximately correspond to temperatures 2 × 10⁷ K, 6 × 10⁷ K, and 2 × 10⁸ K, respectively.
Current usage metrics show cumulative count of Article Views (full-text article views including HTML views, PDF and ePub downloads, according to the available data) and Abstracts Views on Vision4Press platform.
Data correspond to usage on the plateform after 2015. The current usage metrics is available 48-96 hours after online publication and is updated daily on week days.
Initial download of the metrics may take a while.