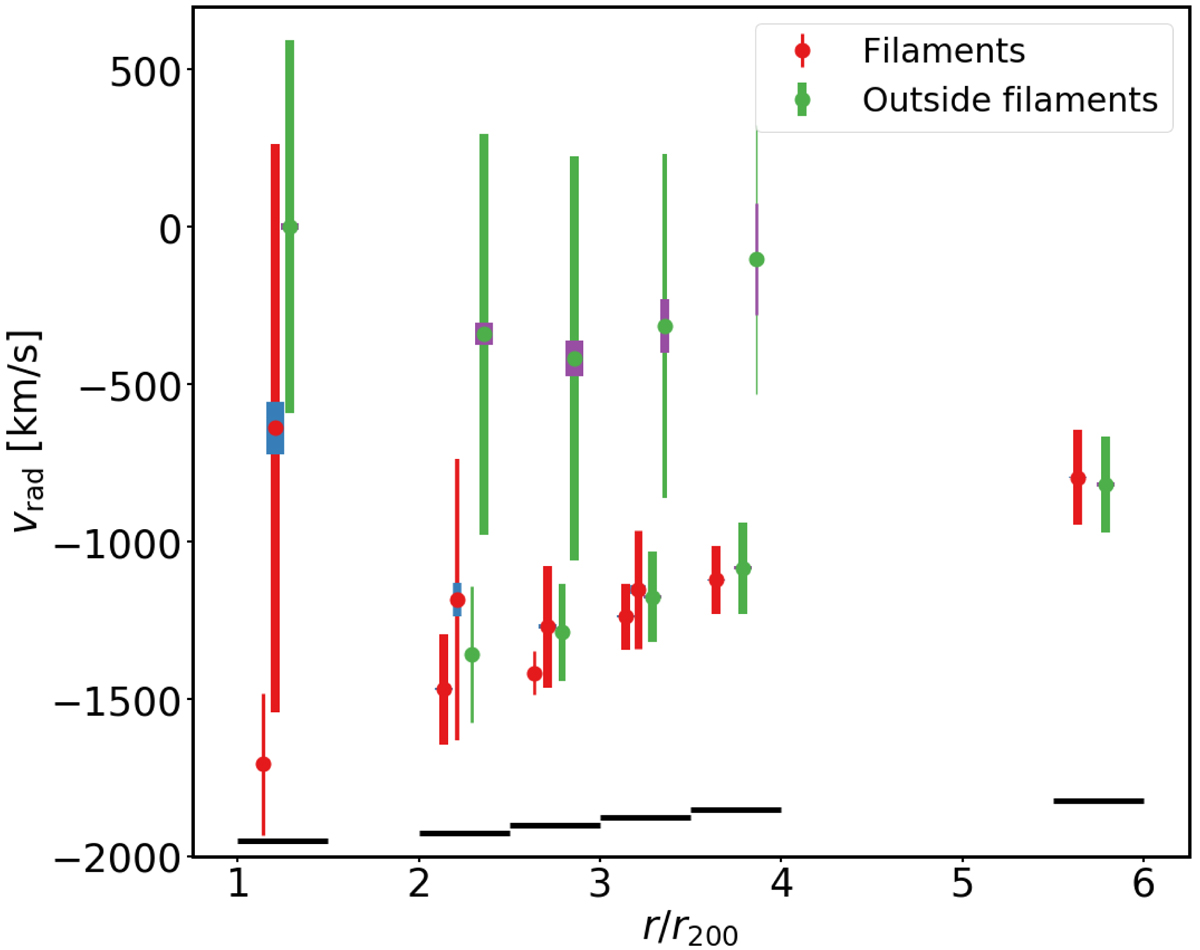
Fig. A.1.
Download original image
Results of double gaussian fitting of the radial velocity distributions, corresponding to the radial regions shown on the different panels in Figure 8. The red and green bars show the 1σ range of the fitted gaussian components within and outside filaments, respectively. The overlaid blue and purple bars show the standard errors of the fitted gaussian mean values. The relative line widths of the bars within a given radial range are proportional to the areas under the two fitted gaussian components (if the ratio is < 0.1 in a given range, only the dominant component is shown). The black horizontal bars mark the radial ranges where the fits are performed.
Current usage metrics show cumulative count of Article Views (full-text article views including HTML views, PDF and ePub downloads, according to the available data) and Abstracts Views on Vision4Press platform.
Data correspond to usage on the plateform after 2015. The current usage metrics is available 48-96 hours after online publication and is updated daily on week days.
Initial download of the metrics may take a while.