Fig. 11.
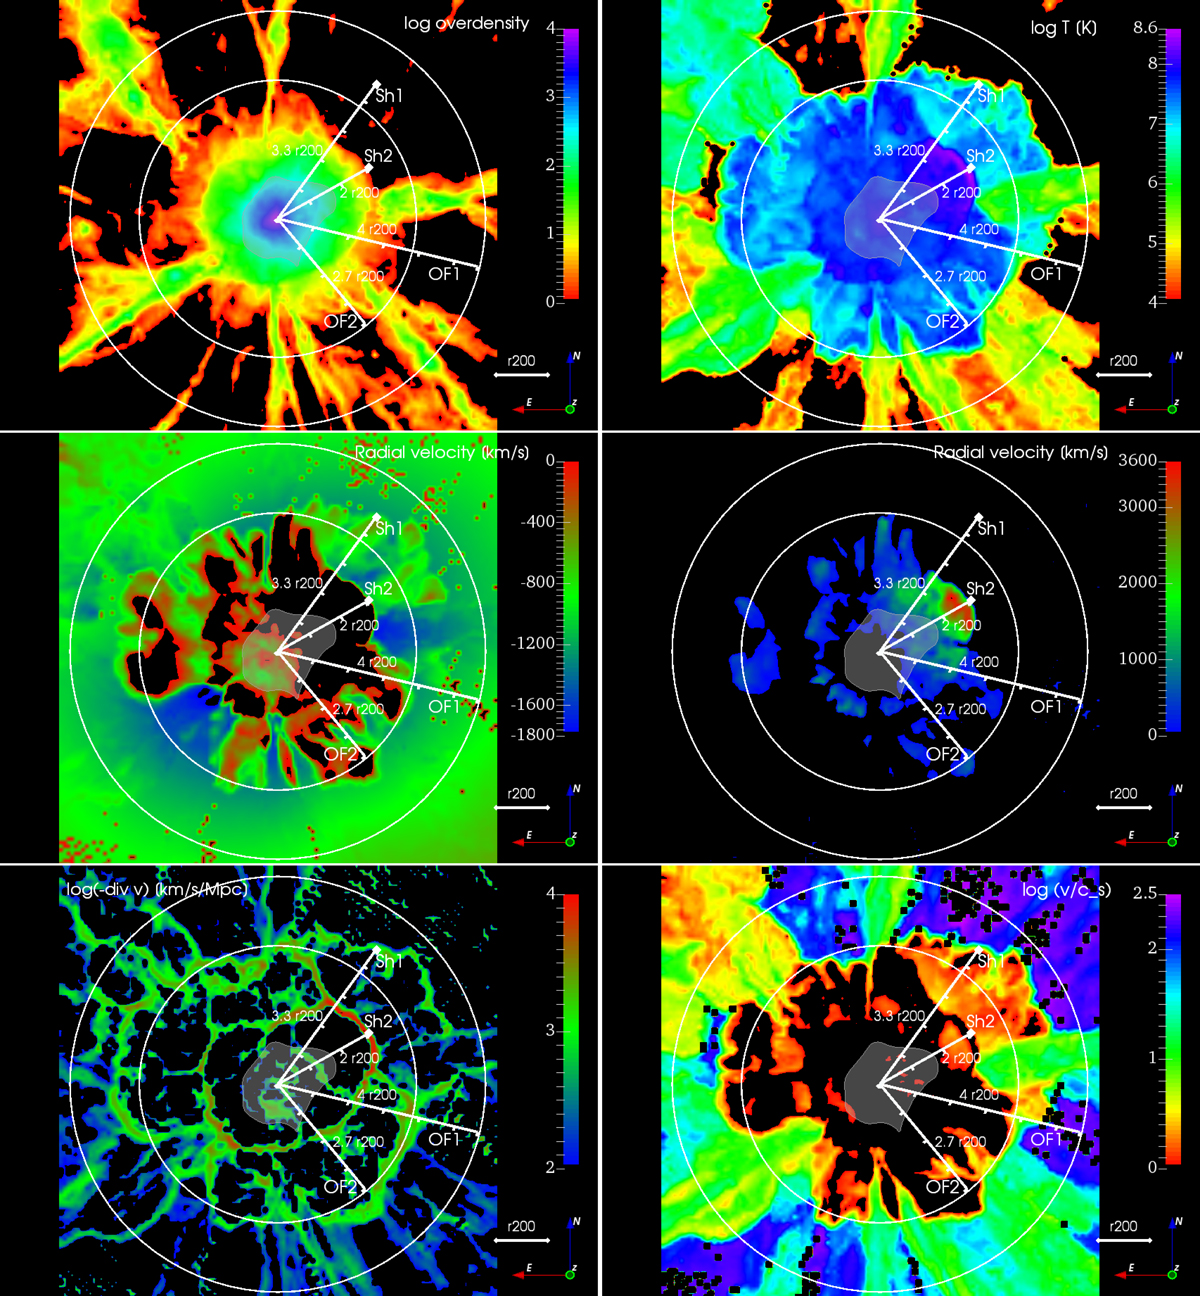
Download original image
Different gas properties in the same region as in Fig. 10. The panels show gas density (top left), temperature (top right), radial velocity separately for inflows (middle left; black region corresponds to outflow) and outflows (middle right; black region corresponds to inflow), negative gas velocity divergence (bottom left; high values correspond to strong compression), and the ratio of bulk speed to sound speed (bottom right). The shaded area in the centre indicates the virial region of the cluster. The white circles delineate the radial regions marked OF1 and OF2 in Fig. 5. White diamonds labelled Sh1 – Sh2 mark the locations of heating events (possibly shocks) in gas outside filaments, for referencing in the text; white lines indicate the cluster-centric distances of the heating events.
Current usage metrics show cumulative count of Article Views (full-text article views including HTML views, PDF and ePub downloads, according to the available data) and Abstracts Views on Vision4Press platform.
Data correspond to usage on the plateform after 2015. The current usage metrics is available 48-96 hours after online publication and is updated daily on week days.
Initial download of the metrics may take a while.