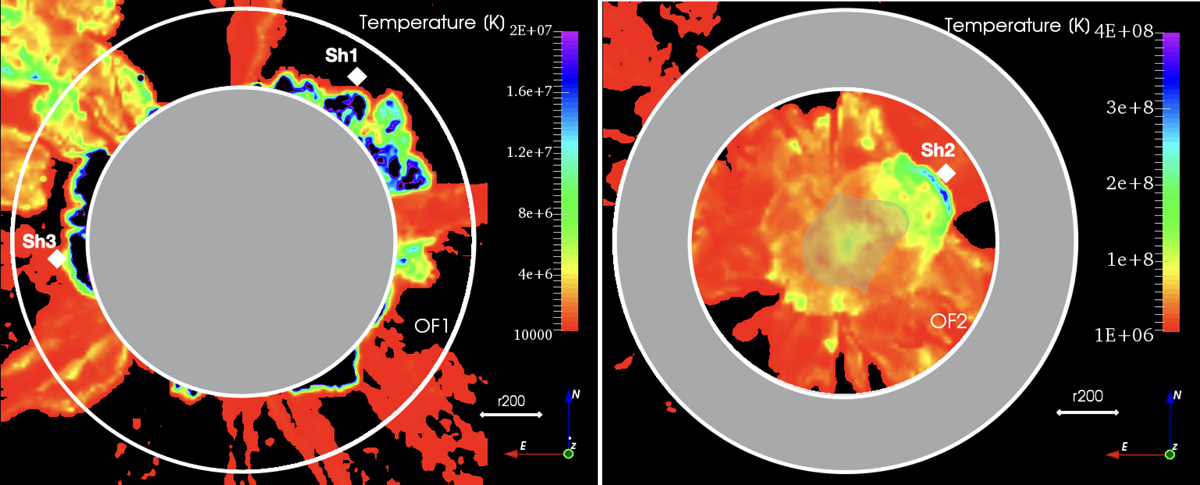
Fig. 10.
Download original image
Temperature of the gas in the OF1 (left; black region corresponds to T < 104 K) and OF2 (right; black region corresponds to T < 106 K) zones in a planar cross-section of size (24 Mpc)2 ≈ (8.5r200)2, crossing through the cluster centre. We note that the temperature scale is different for the two panels, in order to maintain the details in the two regions with very different properties. The white diamonds labelled Sh1–Sh3 mark the locations of heating events (possibly shocks) in gas outside filaments, for referencing in the text. The shaded area in the middle of the right panel shows the virial boundary of the cluster.
Current usage metrics show cumulative count of Article Views (full-text article views including HTML views, PDF and ePub downloads, according to the available data) and Abstracts Views on Vision4Press platform.
Data correspond to usage on the plateform after 2015. The current usage metrics is available 48-96 hours after online publication and is updated daily on week days.
Initial download of the metrics may take a while.