Fig. 9.
Download original image
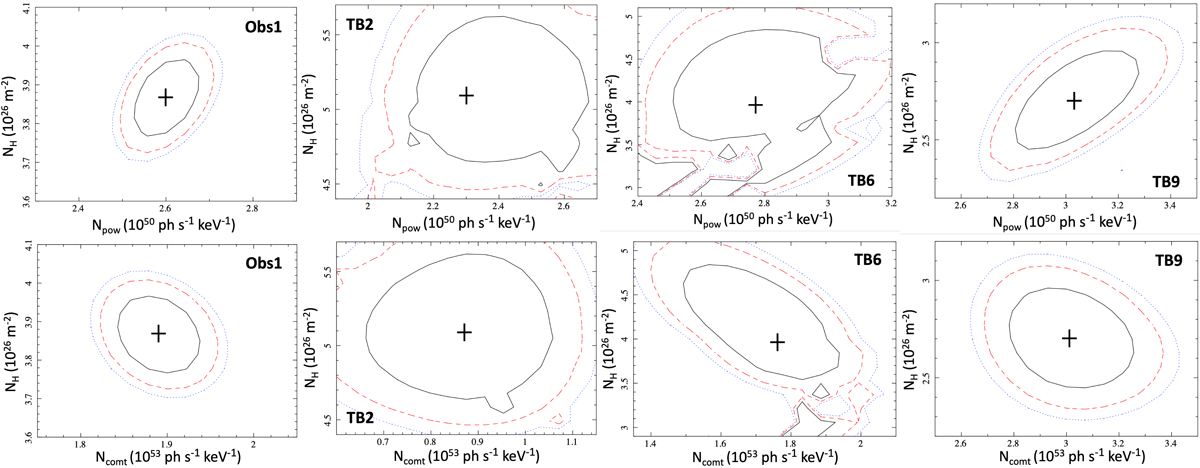
Contour plots of NH (1026 m−1) against Npow (1050 ph s−1 keV−1; top panels) and NH (1026 m−1) against Ncomt (1053 ph s−1 keV−1; bottom panels). From left to right, the panels show the contours for the time-averaged model, TB2, TB6, and TB9, respectively, in Obs 1. The levels of confidence presented are at 68 % (ΔC = 2.30; black solid line), 90 % (ΔC = 4.61; red dashed line), and 95 % (ΔC = 6.17; blue dotted line). The black crosses show the parameter values (but not the errors) from the best fit models in Table 3.
Current usage metrics show cumulative count of Article Views (full-text article views including HTML views, PDF and ePub downloads, according to the available data) and Abstracts Views on Vision4Press platform.
Data correspond to usage on the plateform after 2015. The current usage metrics is available 48-96 hours after online publication and is updated daily on week days.
Initial download of the metrics may take a while.