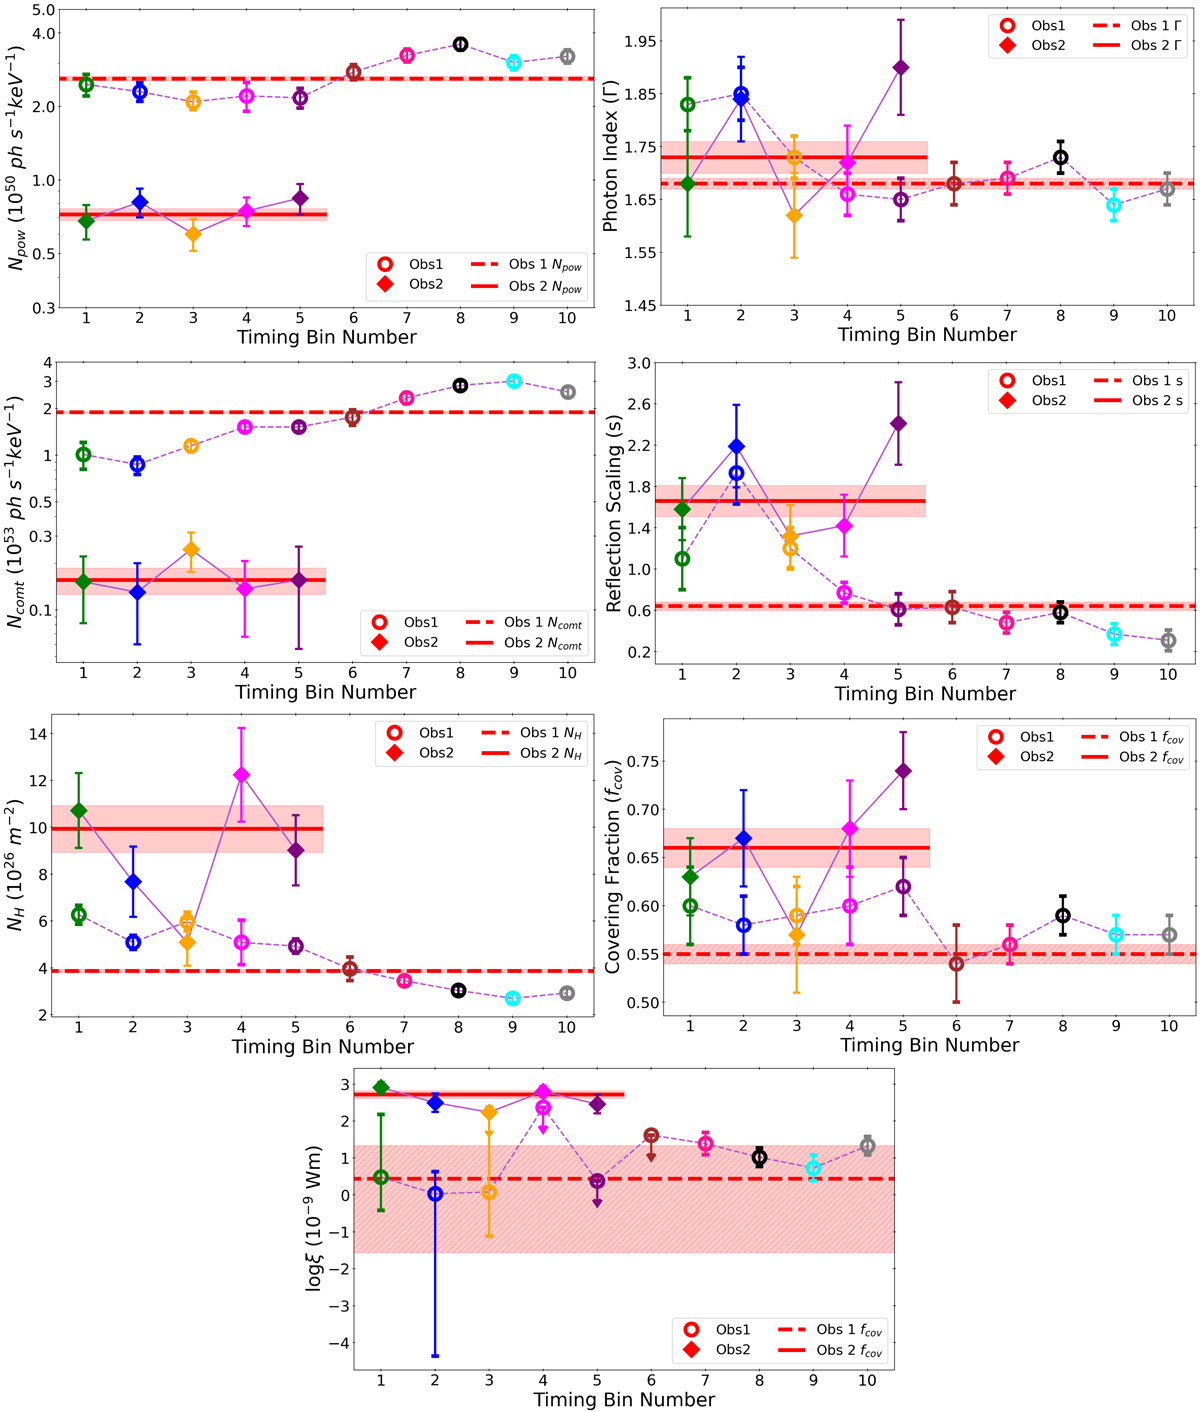
Fig. 7.
Download original image
Model parameter comparisons for each timing bin (TB) in Obs 1 (hollow circles) and Obs 2 (diamonds). The red horizontal dashed and solid lines represent the time-averaged parameter values for Obs 1 and Obs 2, respectively, and the shaded areas show the uncertainties. The TB colours are consistent with their respective spectra in Fig. 4. The model parameter is shown on the y-axis of each panel. The light purple lines (dashed for Obs 1 and solid for Obs 2) connect the TB values for each parameter in the two observations.
Current usage metrics show cumulative count of Article Views (full-text article views including HTML views, PDF and ePub downloads, according to the available data) and Abstracts Views on Vision4Press platform.
Data correspond to usage on the plateform after 2015. The current usage metrics is available 48-96 hours after online publication and is updated daily on week days.
Initial download of the metrics may take a while.