Fig. 6.
Download original image
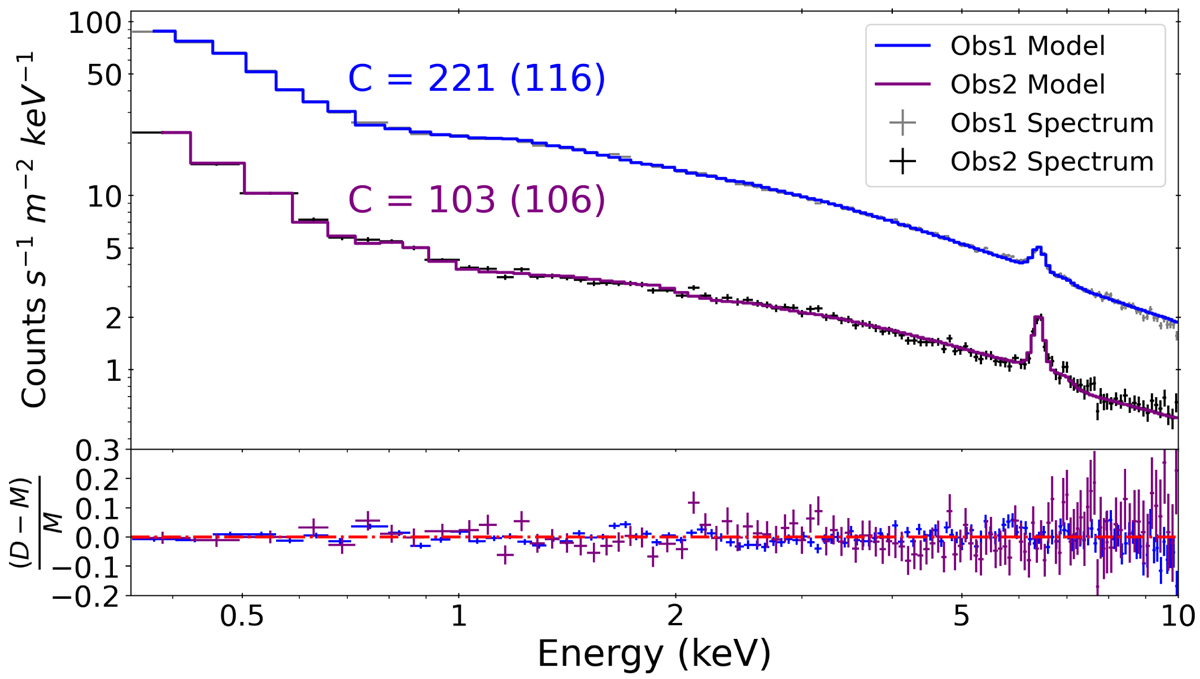
Final best fit models fitted to the time-averaged spectra: Obs 1 grey crosses and blue model; Obs 2 black crosses and purple model. Also shown are the C-statistics and degrees of freedom. The best fit parameter values are displayed in Table 3. The bottom panel shows the residuals between the data and model for Obs 1 (blue) and Obs 2 (purple).
Current usage metrics show cumulative count of Article Views (full-text article views including HTML views, PDF and ePub downloads, according to the available data) and Abstracts Views on Vision4Press platform.
Data correspond to usage on the plateform after 2015. The current usage metrics is available 48-96 hours after online publication and is updated daily on week days.
Initial download of the metrics may take a while.