Fig. C.1.
Download original image
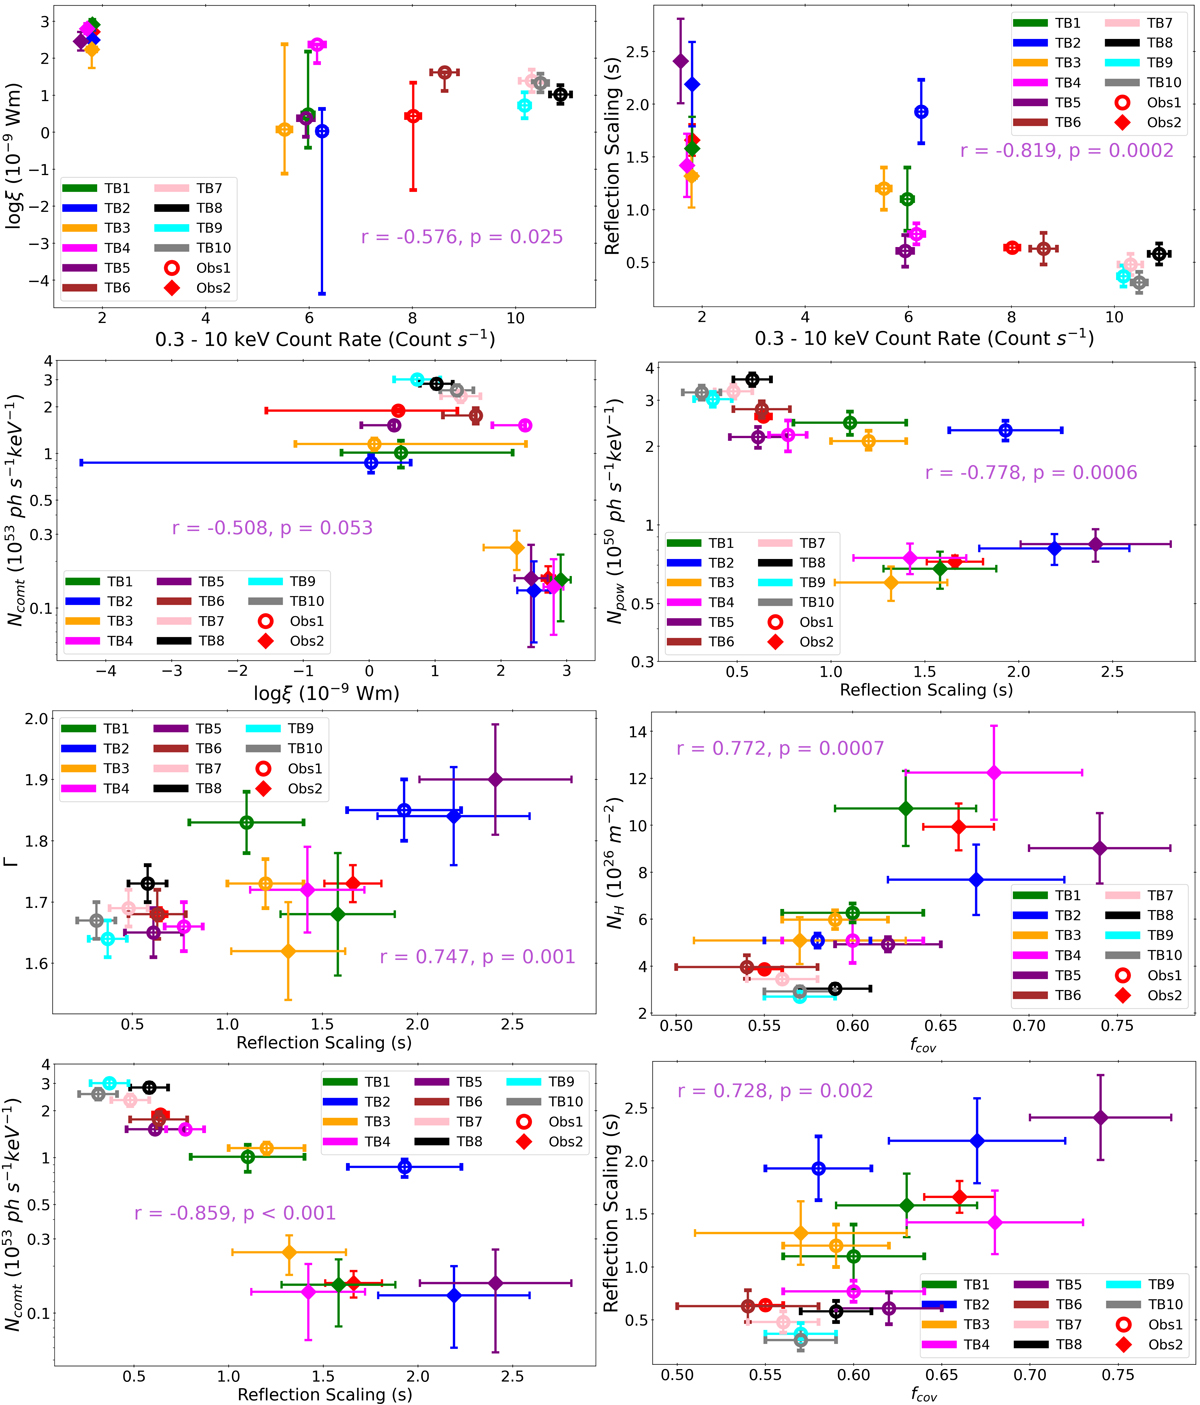
Comparing the relations between parameters in the model, in addition to the parameters discussed in Sect. 5.2 and Fig. 8. Ionisation parameter (top left) and reflection scaling parameter (top right) against the 0.3 - 10 keV count rates. The remaining panels display the correlations between the different parameters in the model. In each panel, the Pearson rank (r) and p-value is shown to display the significance of each correlation.
Current usage metrics show cumulative count of Article Views (full-text article views including HTML views, PDF and ePub downloads, according to the available data) and Abstracts Views on Vision4Press platform.
Data correspond to usage on the plateform after 2015. The current usage metrics is available 48-96 hours after online publication and is updated daily on week days.
Initial download of the metrics may take a while.