Fig. A.1.
Download original image
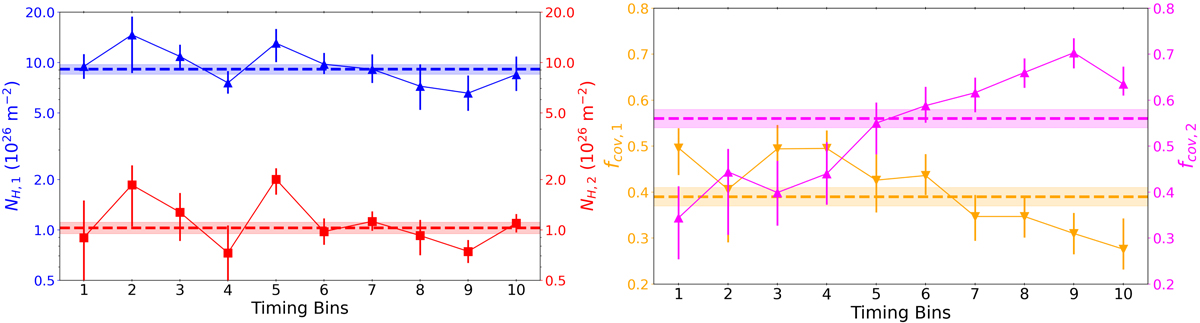
Comparing the parameters of the two obscurer model; details are discussed in Appendix A. Left: Column densities of the two obscurer components, blue for obscurer component 1 (NH, 1) and red for component 2 (NH, 2). Right: Covering fractions of the two obscurer components, orange for obscurer 1 (fcov, 1) and magenta for obscurer 2 (fcov, 2). The dashed lines in each panel show the time-averaged best fit parameter values, with their uncertainties displayed as the shaded areas.
Current usage metrics show cumulative count of Article Views (full-text article views including HTML views, PDF and ePub downloads, according to the available data) and Abstracts Views on Vision4Press platform.
Data correspond to usage on the plateform after 2015. The current usage metrics is available 48-96 hours after online publication and is updated daily on week days.
Initial download of the metrics may take a while.