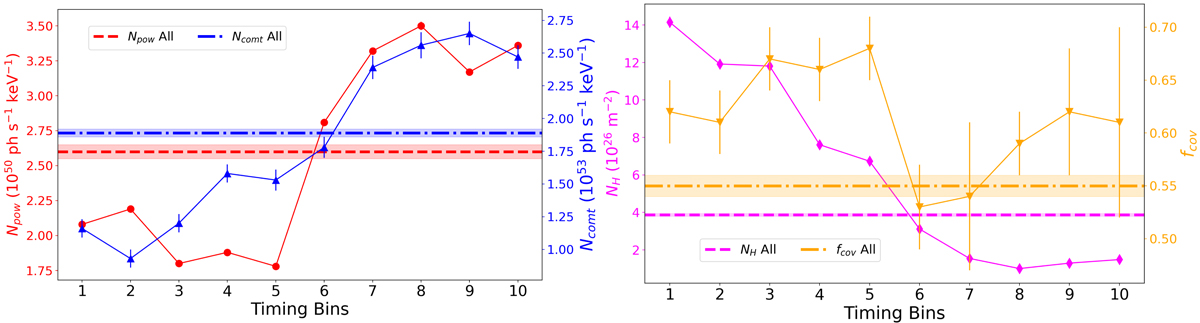
Fig. 11.
Download original image
Further tests to determine the cause of the observed variability. Left: Fixing the obscurer parameters to their time-averaged values in Obs 1 (Table 3), and fitting Npow (red circles) and Ncomt (blue triangles) in each TB. Right: Fixing the continuum parameters to their time-averaged values and fitting NH (magenta diamonds) and fcov (orange triangles). In both scenarios the changes in the parameters suggest that they could contribute to the observed variability. See Sect. 5.3 for details. The uncertainties on Npow (left) and NH (right) are relatively small that they are within the data points. The photon index and reflection scaling parameters from the continuum show the same trends as Fig. 7 when the obscurer parameters are fixed. The ionisation parameter of the obscurer does not change when the continuum parameters are fixed.
Current usage metrics show cumulative count of Article Views (full-text article views including HTML views, PDF and ePub downloads, according to the available data) and Abstracts Views on Vision4Press platform.
Data correspond to usage on the plateform after 2015. The current usage metrics is available 48-96 hours after online publication and is updated daily on week days.
Initial download of the metrics may take a while.