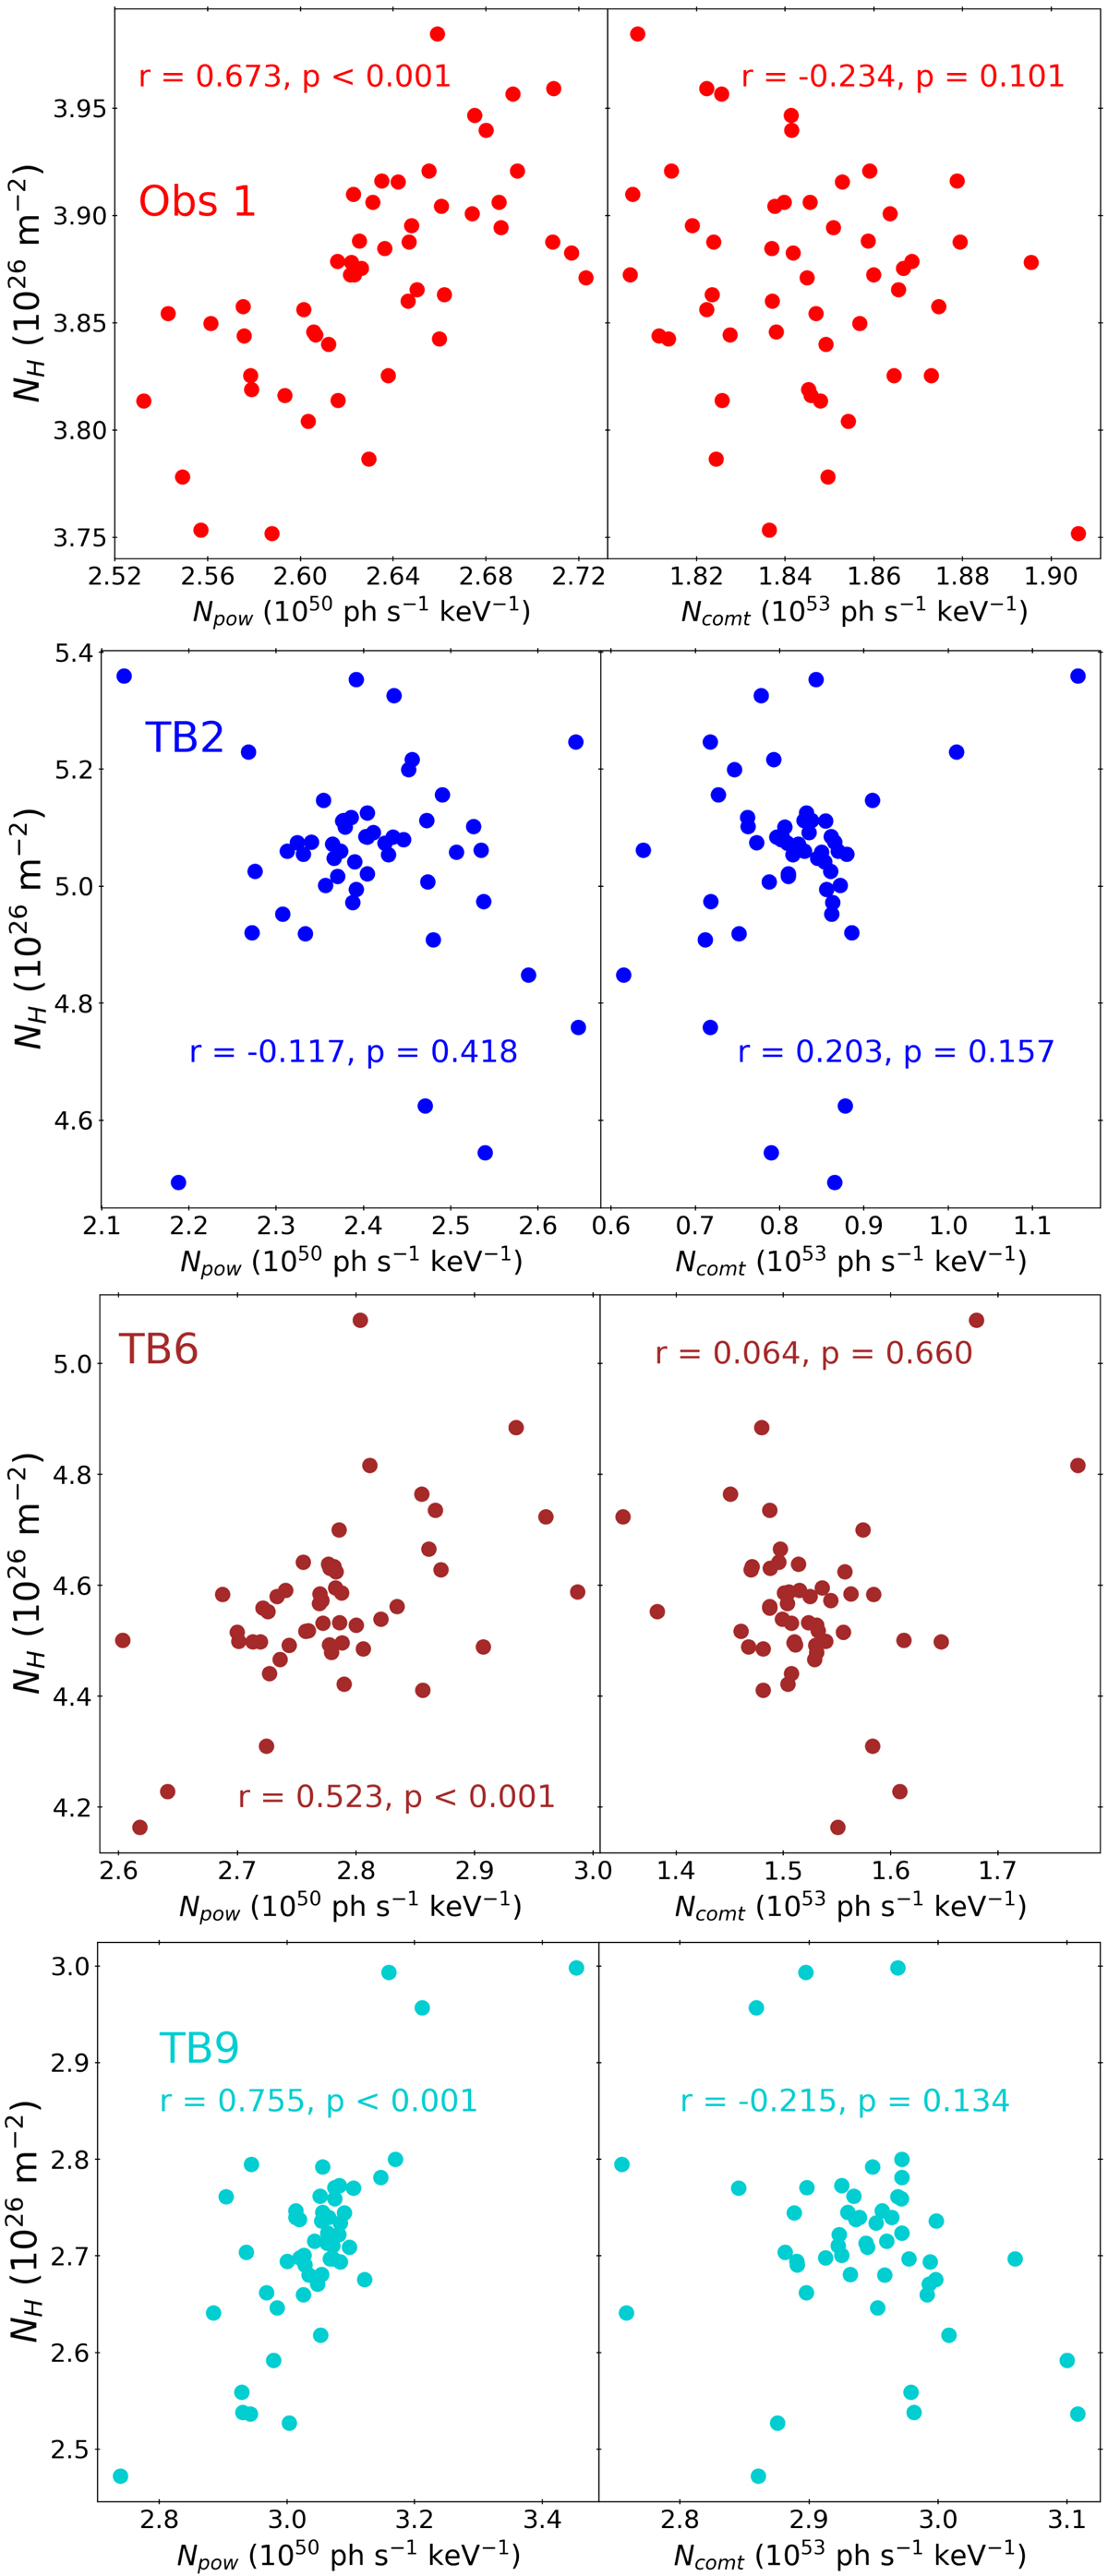
Fig. 10.
Download original image
Monte Carlo spectral simulation results for the time-averaged model (top panel; red) and the models from TB2 (top-middle; blue), TB6 (bottom-middle; brown), and TB9 (bottom panel; cyan). The left and right sides of each panel display the results of NH against Npow and NH and Ncomt, respectively, after fitting the best fit models to the simulated spectra 50 times each. Also displayed in each panel are the Pearson rank (r) and p-values to demonstrate the linear correlation coefficient and corresponding probabilities for the parameters, used to determine parameter degeneracies.
Current usage metrics show cumulative count of Article Views (full-text article views including HTML views, PDF and ePub downloads, according to the available data) and Abstracts Views on Vision4Press platform.
Data correspond to usage on the plateform after 2015. The current usage metrics is available 48-96 hours after online publication and is updated daily on week days.
Initial download of the metrics may take a while.