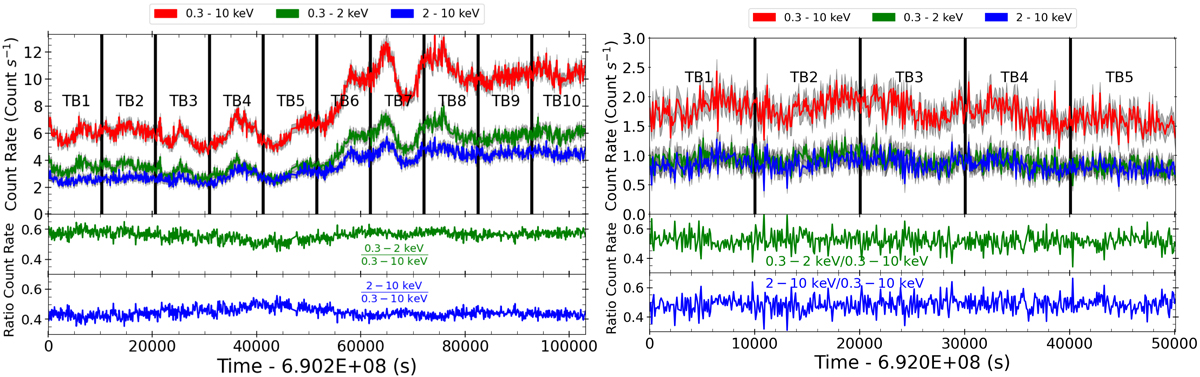
Fig. 1.
Download original image
Light curves for Obs 1 (left) and Obs 2 (right). Top panels: Three different energy bands: 0.3–10 keV (red), 0.3–2 keV (green), and 2–10 keV (blue). Also displayed are the timing bins (TB) from which we extracted EPIC-PN spectra for our analysis (see Sect. 3.2 for details). The light curves were binned at 100 s. The errors on the energy bin fluxes are shown by the shaded regions. Bottom panels: Ratio light curves between the 0.3–2 keV (green) and 2–10 keV (blue) energy bands in the top panel divided by the full 0.3–10 keV light curve (red line). The Obs 1 ratios are on the left hand side and the Obs 2 ratios are on the right.
Current usage metrics show cumulative count of Article Views (full-text article views including HTML views, PDF and ePub downloads, according to the available data) and Abstracts Views on Vision4Press platform.
Data correspond to usage on the plateform after 2015. The current usage metrics is available 48-96 hours after online publication and is updated daily on week days.
Initial download of the metrics may take a while.