Fig. 9
Download original image
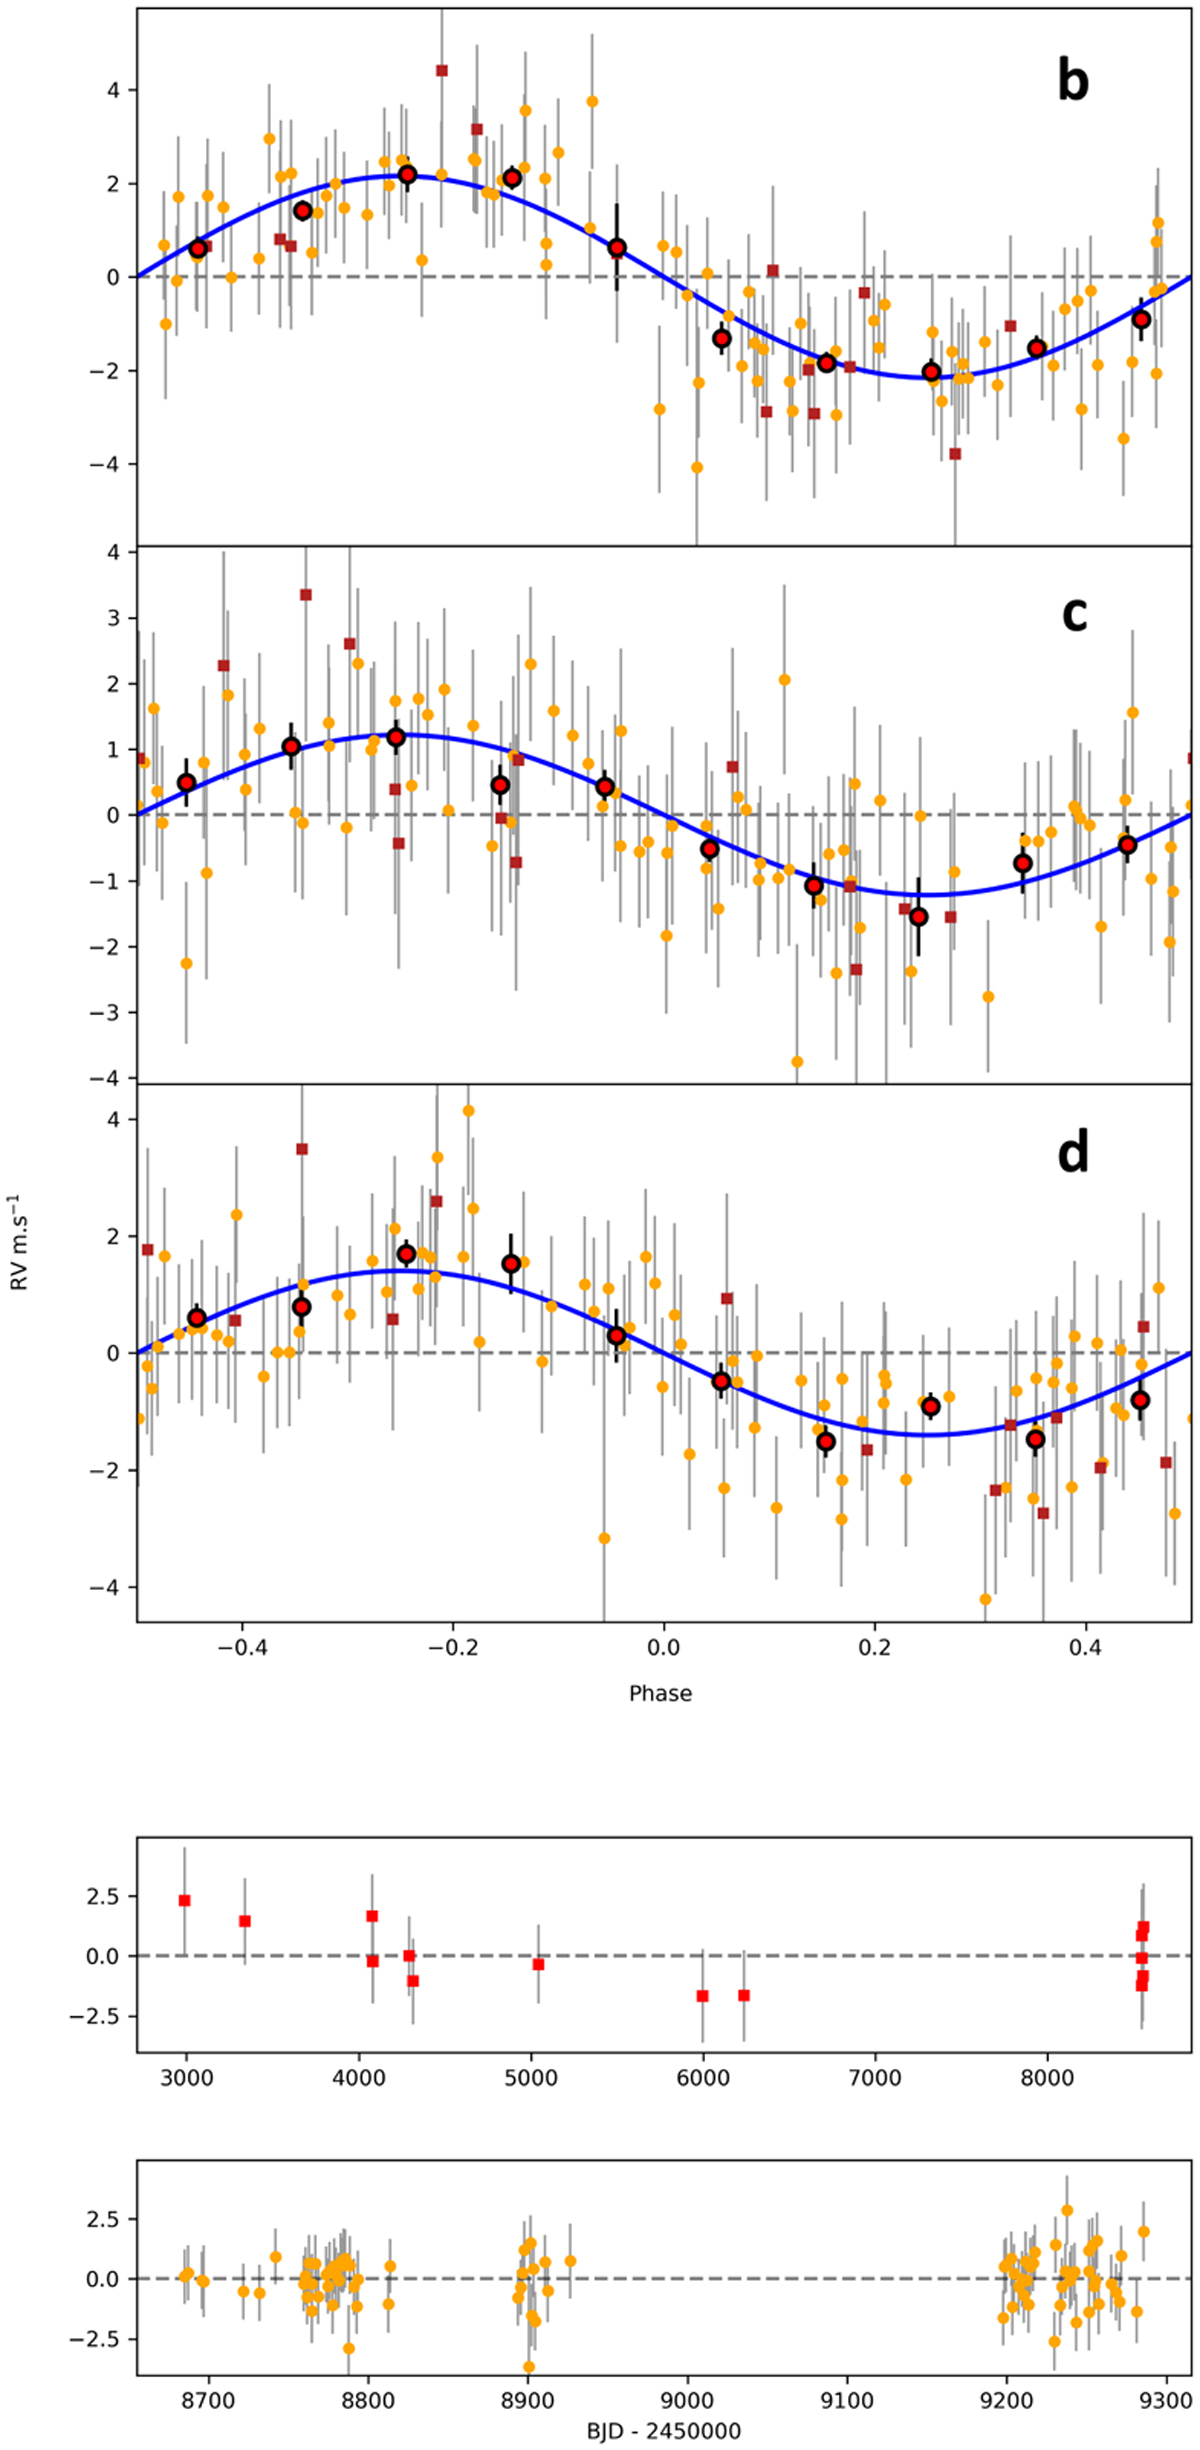
Phase-folded radial velocities for planets LTT 1445A b (top panel), c (second panel), and d (third panel). The red squares are HARPS data, the orange circles are ESPRESSO data, and the red circles are the ESPRESSO data binned in 10 bins. The blue lines indicate the best fit obtained with the combined photometric and radial velocity datasets. The two last panels show the residuals for HARPS observations (second to bottom panel) and ESPRESSO (bottom panel).
Current usage metrics show cumulative count of Article Views (full-text article views including HTML views, PDF and ePub downloads, according to the available data) and Abstracts Views on Vision4Press platform.
Data correspond to usage on the plateform after 2015. The current usage metrics is available 48-96 hours after online publication and is updated daily on week days.
Initial download of the metrics may take a while.