Fig. 8
Download original image
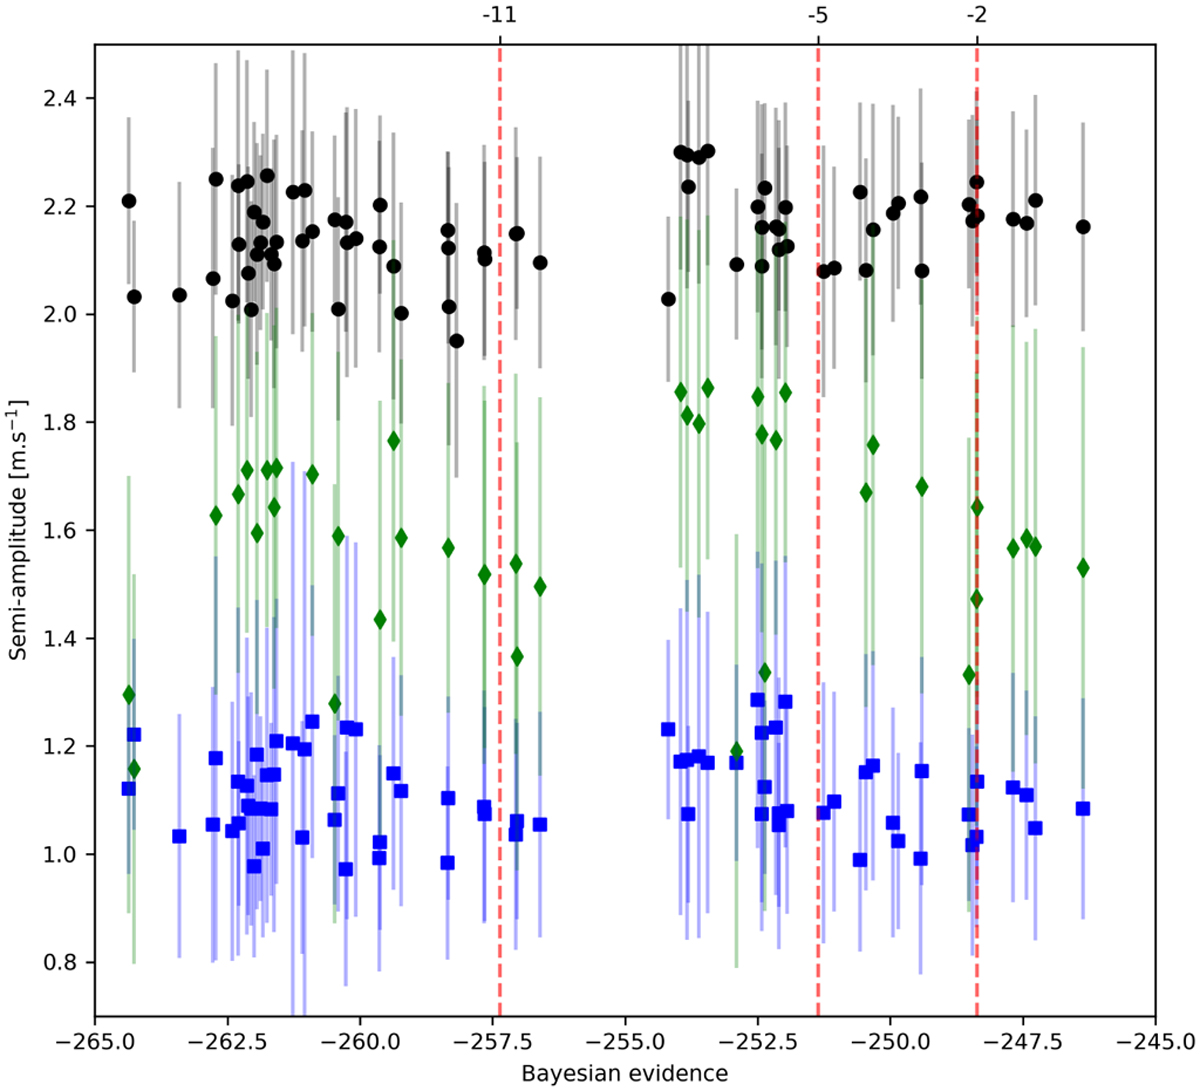
Radial velocity semi-amplitude of planets b (black), c (blue), and d (green) as a function of the logarithm of the Bayesian evidence obtained with the inference on the radial velocity dataset alone. The higher the Bayesian evidence, the more favoured the model. The vertical dashed red line indicates the different thresholds in the difference with the logarithm of the Bayesian evidence of the best model. Models with a difference larger than 5 are strongly rejected.
Current usage metrics show cumulative count of Article Views (full-text article views including HTML views, PDF and ePub downloads, according to the available data) and Abstracts Views on Vision4Press platform.
Data correspond to usage on the plateform after 2015. The current usage metrics is available 48-96 hours after online publication and is updated daily on week days.
Initial download of the metrics may take a while.