Fig. 4
Download original image
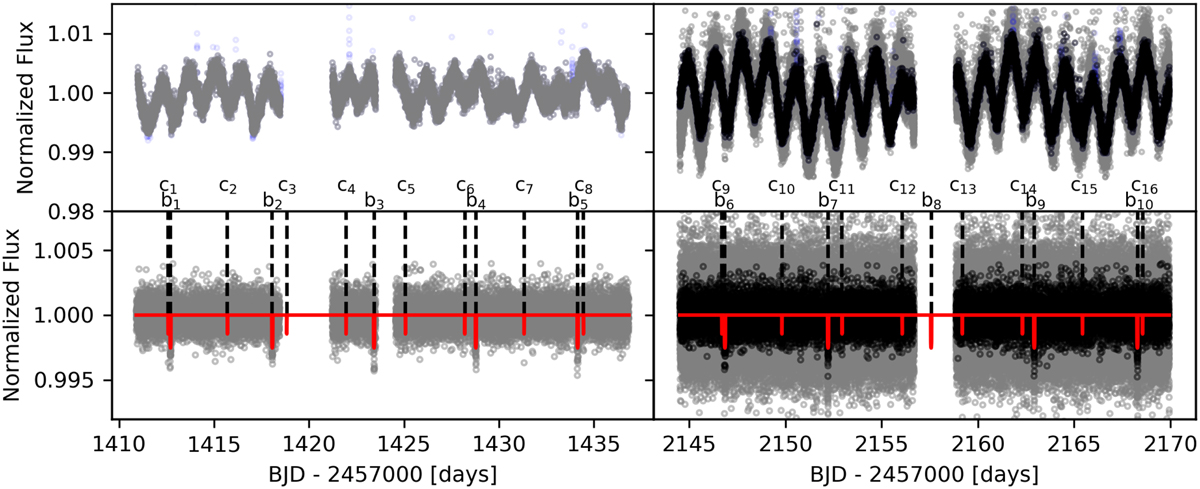
LTT1445 ligt curves from TESS sectors 4 and 31. First row: TESS PDCSAP light curve for sector 4 with 2-min cadence (first column) and sector 31 (second column) for a 2-min cadence (black) and a 20-s cadence (grey). A clear modulation with a period of 1.4 days is clearly visible. Second row: Respective detrended light curves with the best-fit model (in red) from the analysis of Sect. 4.2.2. The vertical lines identify the transit for each planet: b1 to b10 for planet b, and c1 to c16 for planet c. The light blue dots in the 2-min cadence in the upper panels are the outliers in the dataset that were removed from the PDCSAP light curves.
Current usage metrics show cumulative count of Article Views (full-text article views including HTML views, PDF and ePub downloads, according to the available data) and Abstracts Views on Vision4Press platform.
Data correspond to usage on the plateform after 2015. The current usage metrics is available 48-96 hours after online publication and is updated daily on week days.
Initial download of the metrics may take a while.