Fig. 10
Download original image
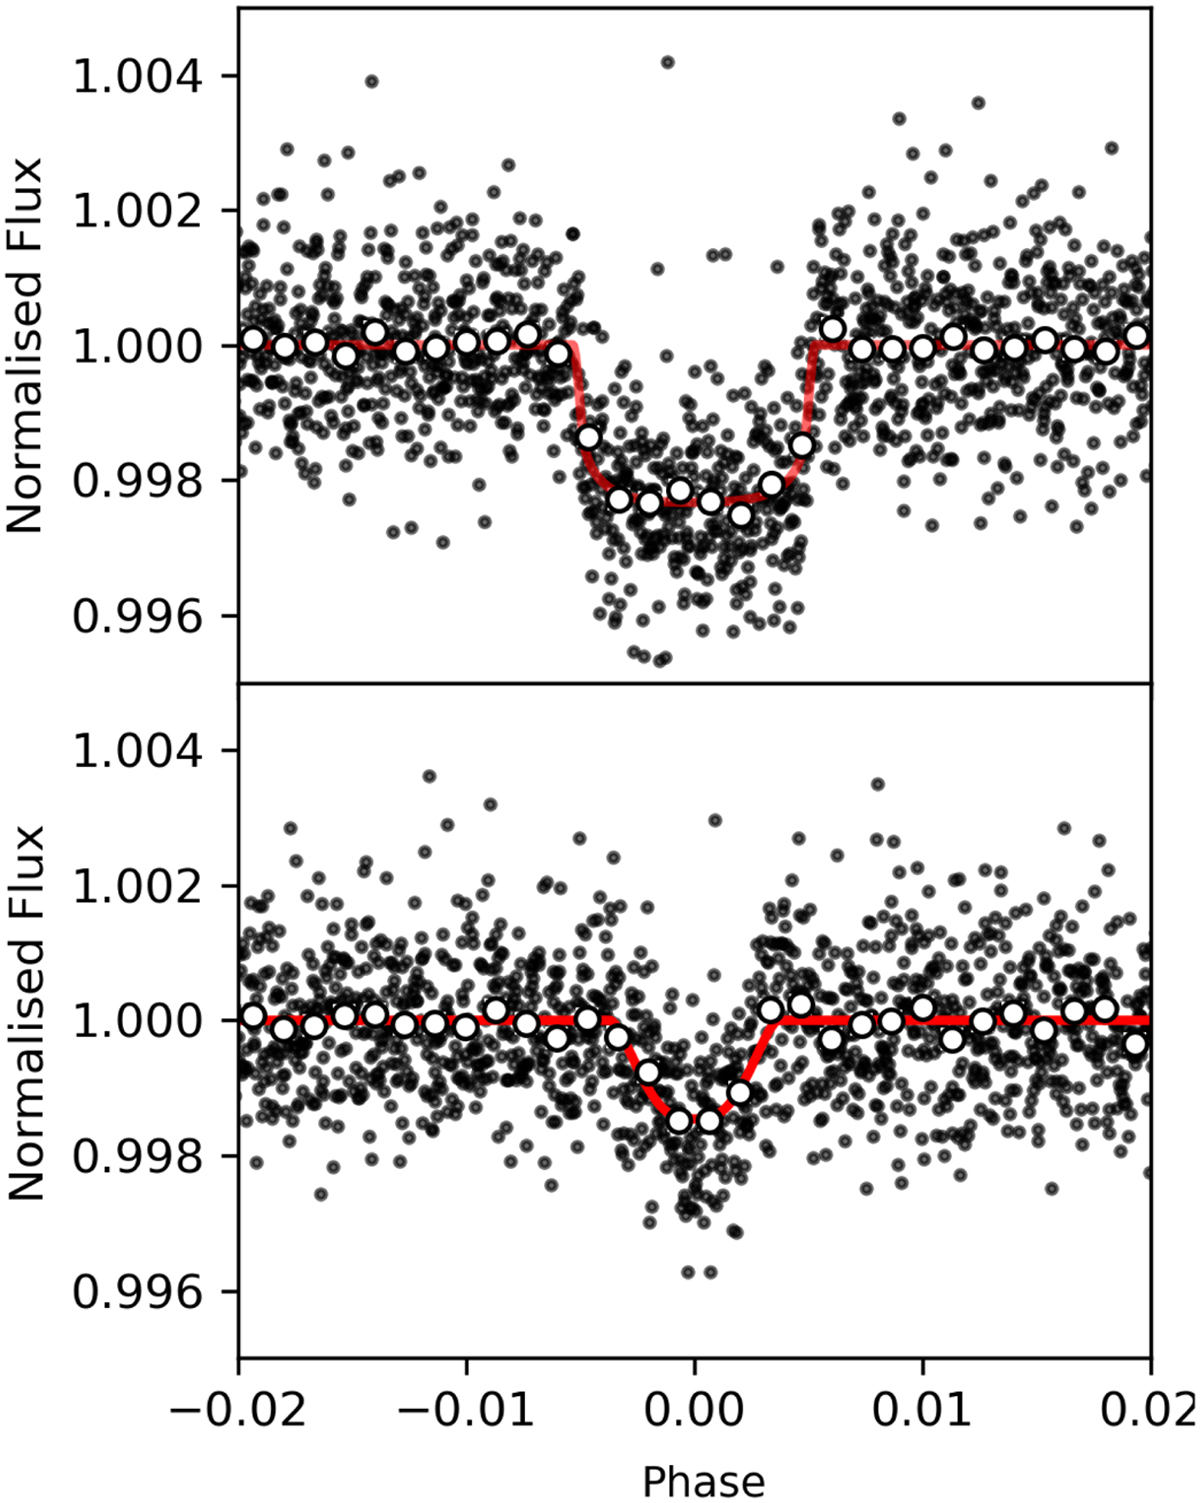
Phase-folded light curves with both sectors at a 2-min cadence for planet b (top panel) and planet c (bottom panel). The black dots show the flux for the 2-min cadence detrended with the GP from the best-fit model obtained with the combined photometric and radial velocity datasets. The white dots with small error bars are the same flux binned. The red line shows the transit model component of the best fit.
Current usage metrics show cumulative count of Article Views (full-text article views including HTML views, PDF and ePub downloads, according to the available data) and Abstracts Views on Vision4Press platform.
Data correspond to usage on the plateform after 2015. The current usage metrics is available 48-96 hours after online publication and is updated daily on week days.
Initial download of the metrics may take a while.