Fig. E.1.
Download original image
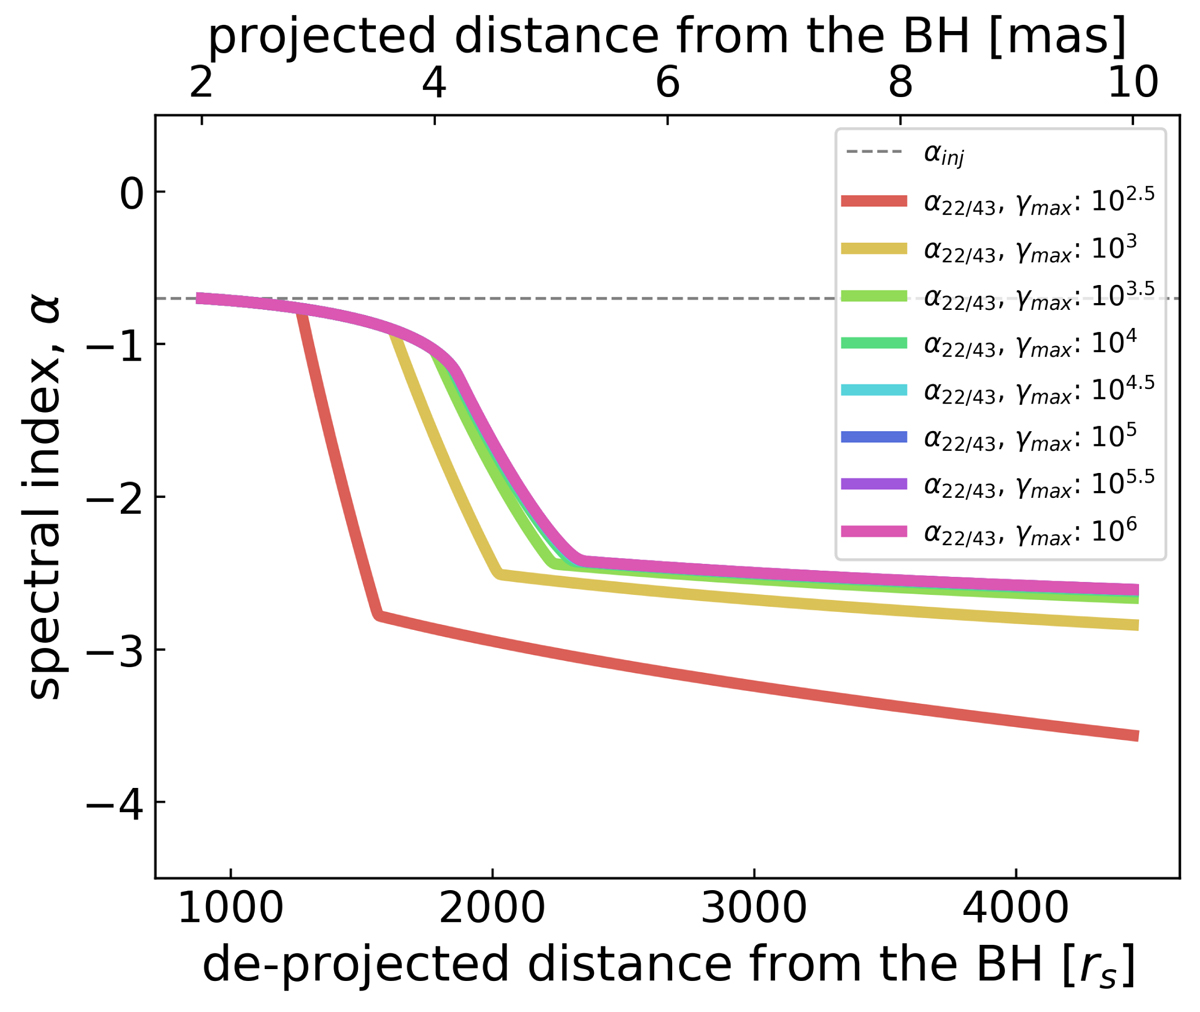
Comparison of model spectral index distributions using nonthermal electron injection functions with different γinj, max. Distributions with different colors represent different values of γinj, max. For all distributions, the magnetic field strength was assumed to be Bi = 0.3G. As γinj, max increases, the spectral index distributions converge and there is little change between the models with γinj, max = 104.5 and γinj, max = 106.
Current usage metrics show cumulative count of Article Views (full-text article views including HTML views, PDF and ePub downloads, according to the available data) and Abstracts Views on Vision4Press platform.
Data correspond to usage on the plateform after 2015. The current usage metrics is available 48-96 hours after online publication and is updated daily on week days.
Initial download of the metrics may take a while.