Fig. C.1.
Download original image
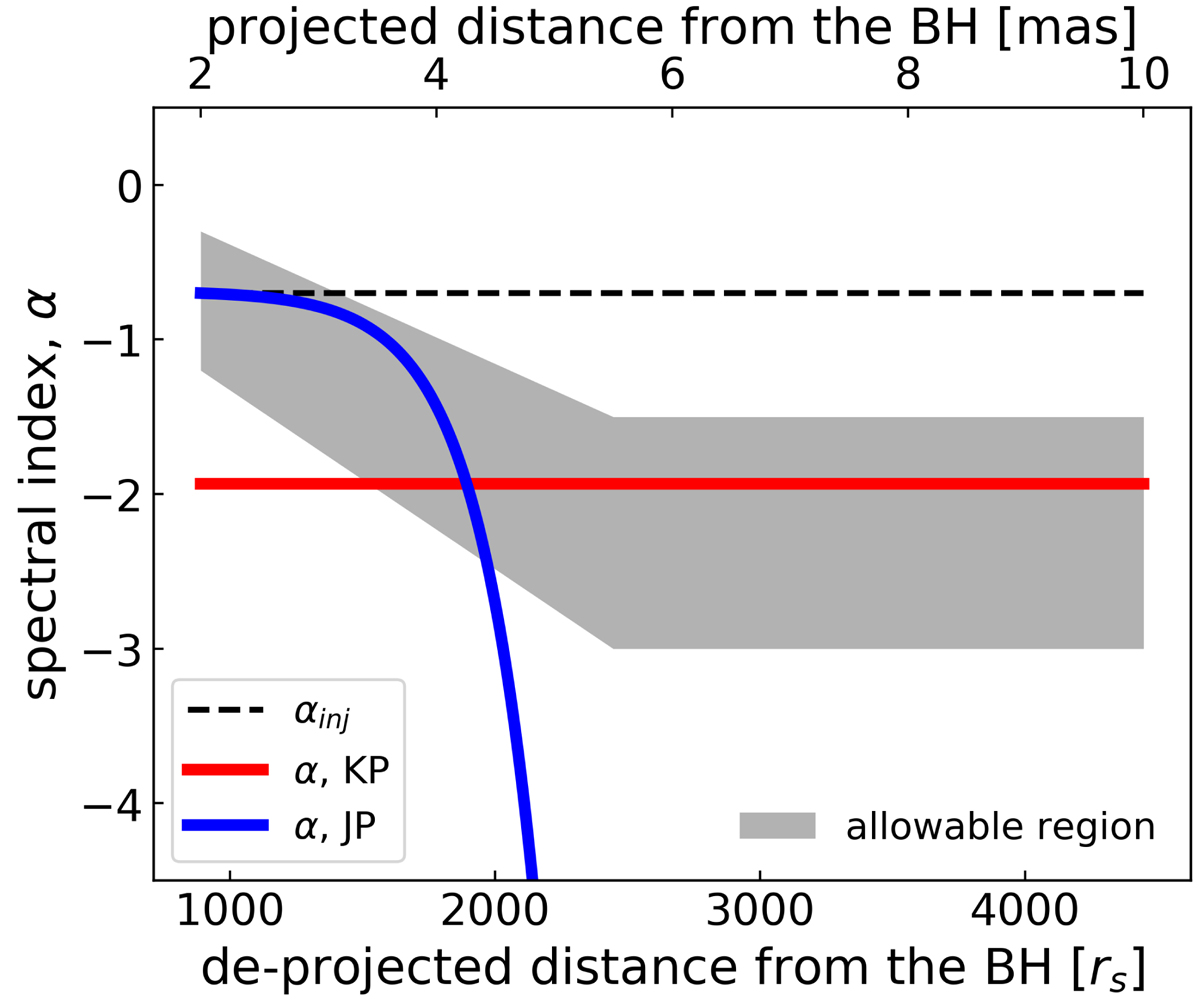
Schematic diagram of the spectral index distributions without electron injection, assuming different synchrotron emission models. The blue line assumes the JP model, which is used in this study. The red line shows the spectral index distribution with the KP model. Assuming that the injection spectral index is αinj = −0.7, the expected index after steepening is 4/3αinj − 1 ≈ −1.933, which is within the allowable range obtained from observation.
Current usage metrics show cumulative count of Article Views (full-text article views including HTML views, PDF and ePub downloads, according to the available data) and Abstracts Views on Vision4Press platform.
Data correspond to usage on the plateform after 2015. The current usage metrics is available 48-96 hours after online publication and is updated daily on week days.
Initial download of the metrics may take a while.