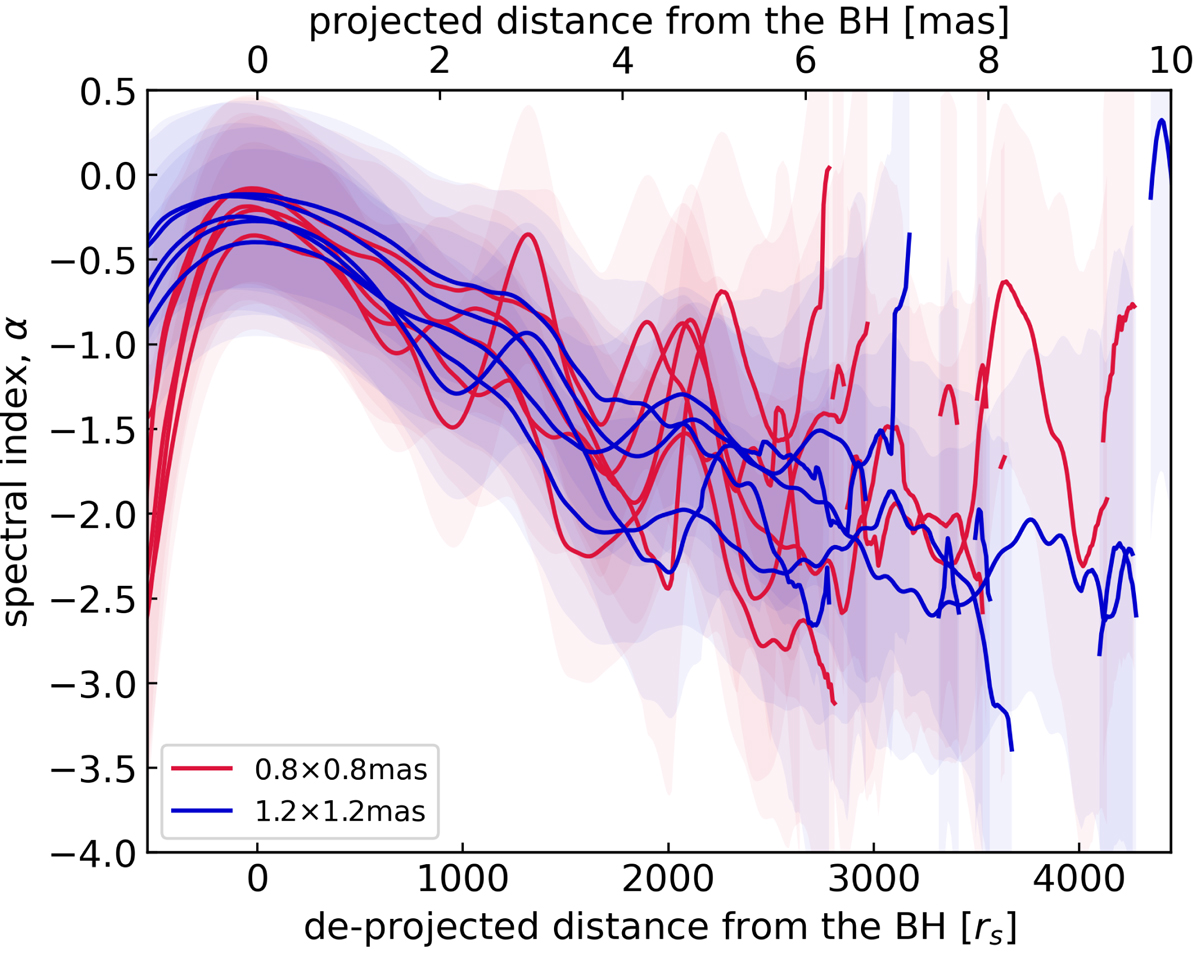
Fig. B.1.
Download original image
Spectral index distributions between VLBA 22 and 43 GHz maps convolved with beams of different sizes. The blue lines are convolved with a circular beam of 1.2 × 1.2 mas, where the radius is the same as the major axis of the KaVA 22 GHz beam. The red lines are convolved with 0.8 × 0.8 mas, which is equal to the major axis of the VLBA 22 GHz beam. The distribution with the VLBA beam has a larger scattering than the distribution with the KaVA beam.
Current usage metrics show cumulative count of Article Views (full-text article views including HTML views, PDF and ePub downloads, according to the available data) and Abstracts Views on Vision4Press platform.
Data correspond to usage on the plateform after 2015. The current usage metrics is available 48-96 hours after online publication and is updated daily on week days.
Initial download of the metrics may take a while.