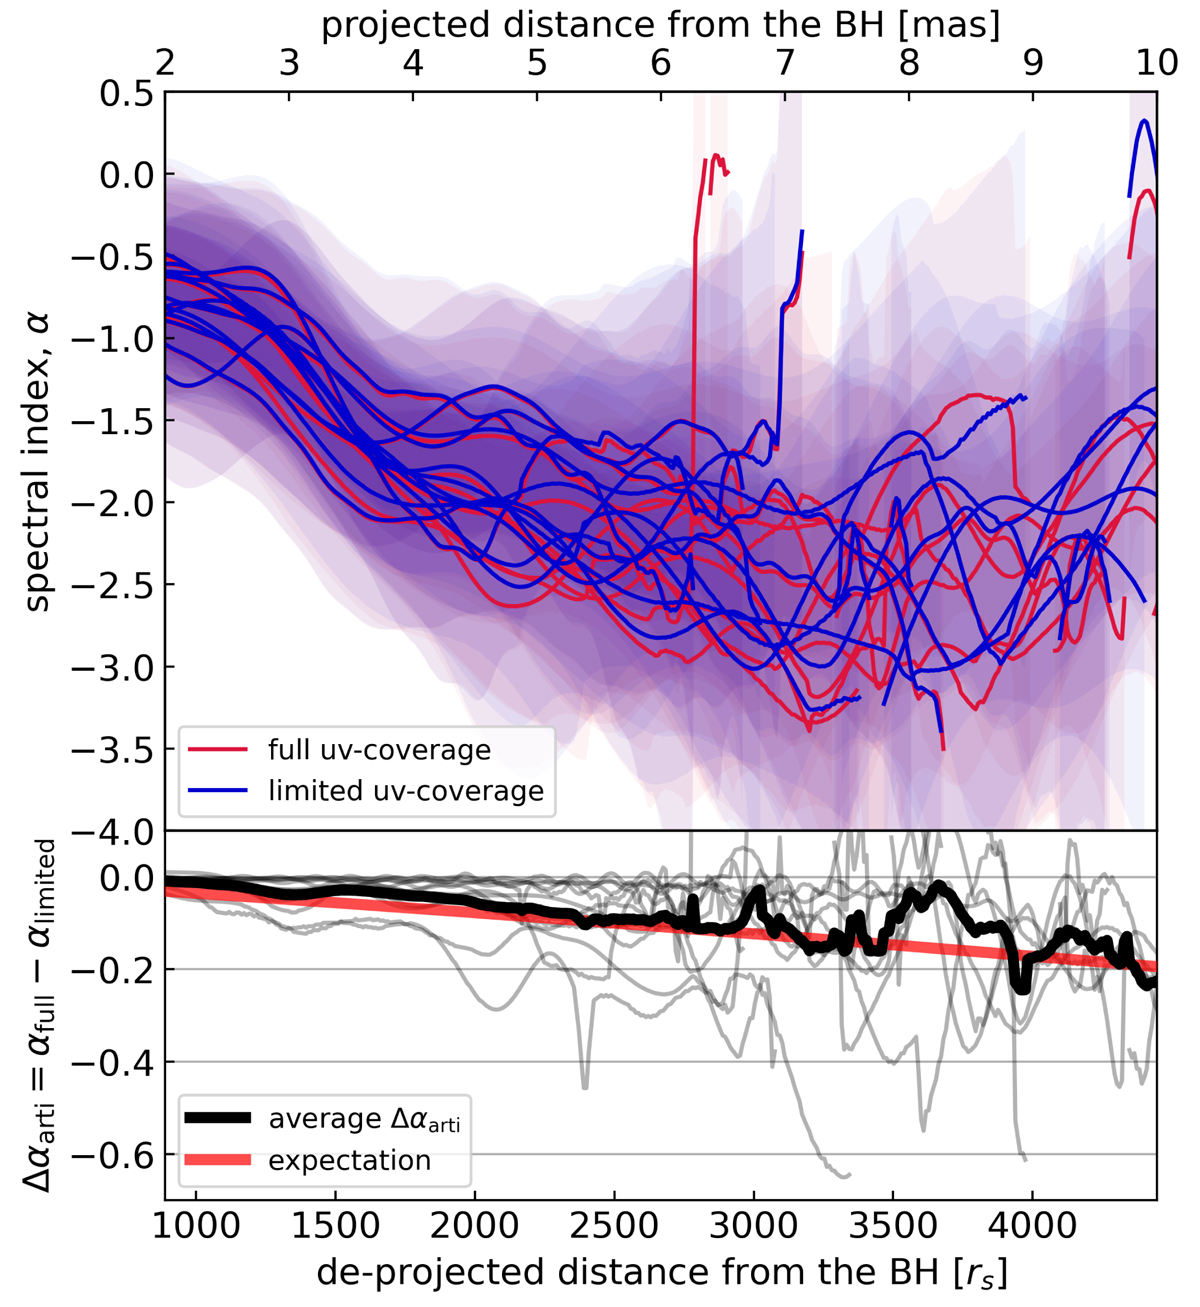
Fig. A.1.
Download original image
Effect of the (u, v)-range matching on the spectral index distribution. The upper panel shows spectral index distributions between 22 and 43 GHz before (red lines) and after (blue lines) matching the (u, v) range. Distributions using the full (u, v) range have steeper spectra at longer distances. Differences between the two distributions (i.e., artificial steeping due to inconsistent (u, v) ranges) are indicated by gray lines in the lower panel. The thick black line is the average difference, and the red line is the expected artificial steepening along the jet. See text for details.
Current usage metrics show cumulative count of Article Views (full-text article views including HTML views, PDF and ePub downloads, according to the available data) and Abstracts Views on Vision4Press platform.
Data correspond to usage on the plateform after 2015. The current usage metrics is available 48-96 hours after online publication and is updated daily on week days.
Initial download of the metrics may take a while.