Fig. 5.

Download original image
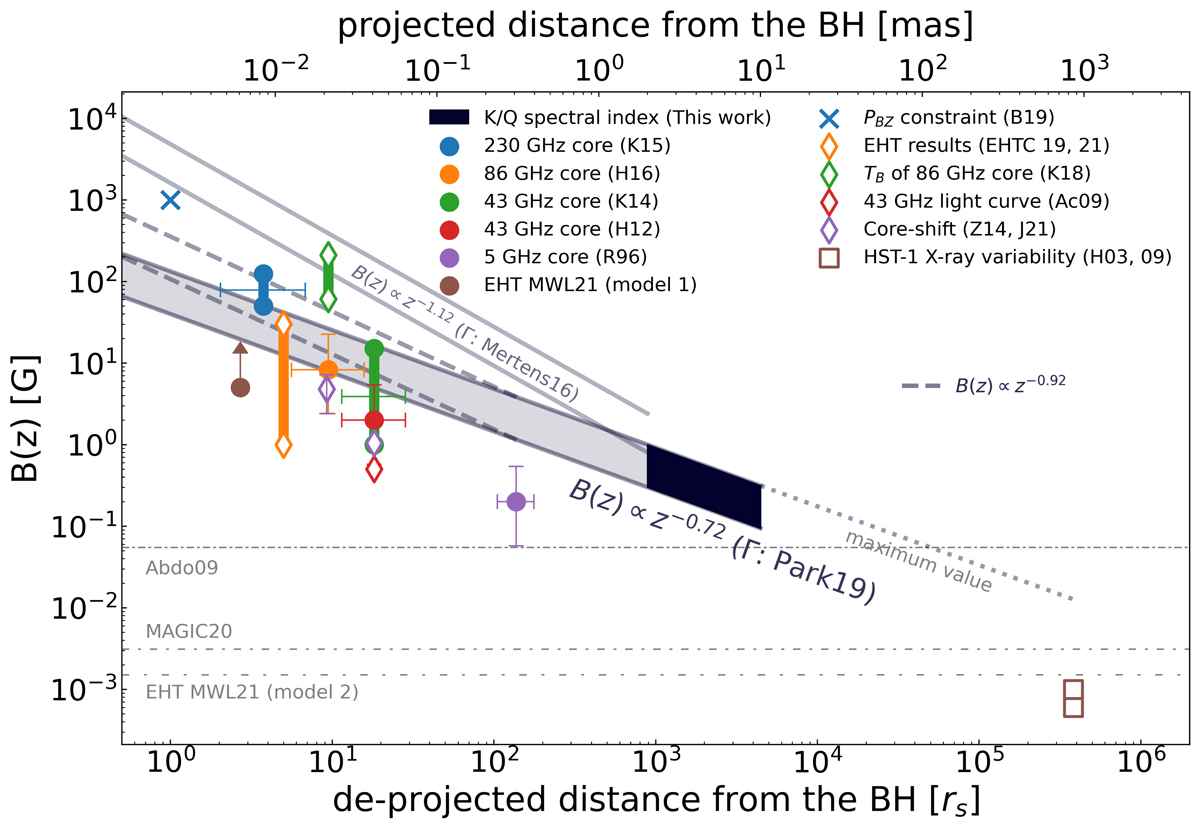
Magnetic field distribution of the M 87 jet. The black area is the distribution of the magnetic field strength estimated in this study. The solid lines with the gray shaded region are the extrapolation of the upper and lower limits of the result in the upstream direction (B(z)∝z−0.72). The dashed lines are the magnetic field distribution which assumes a steeper slope of the jet radius profile in the region closer to the SMBH (B(z)∝z−0.92). The solid lines without a shaded region are the upper and lower bounds of the magnetic field distribution, assuming fast acceleration in the region closer within 2 mas (B(z)∝z−1.12). The dotted line is the extrapolation of the maximum values of the result to the downstream region. Markers are estimated magnetic field strength from previous studies. The blue cross is the theoretically expected magnetic field strength in a Blandford-Znajek jet (Blandford et al. 2019). The circles are magnetic field strength values obtained in VLBI cores derived using SSA theory (Kino et al. 2014, 2015; Hada et al. 2012, 2016; Reynolds et al. 1996; EHT MWL Science Working Group 2021). The diamonds are values obtained from VLBI observations using various methods other than SSA theory (Acciari et al. 2009; Kim et al. 2018b; Zamaninasab et al. 2014; Event Horizon Telescope Collaboration 2019, 2021; Jiang et al. 2021). The squares are the magnetic field strengths at HST-1 (Harris et al. 2003, 2009). The horizontal dotted-dashed lines are the magnetic field strengths estimated by fitting the broadband SED of the jet using a single-zone SSC emission model (Abdo et al. 2009; MAGIC Collaboration 2020; EHT MWL Science Working Group 2021).
Current usage metrics show cumulative count of Article Views (full-text article views including HTML views, PDF and ePub downloads, according to the available data) and Abstracts Views on Vision4Press platform.
Data correspond to usage on the plateform after 2015. The current usage metrics is available 48-96 hours after online publication and is updated daily on week days.
Initial download of the metrics may take a while.


