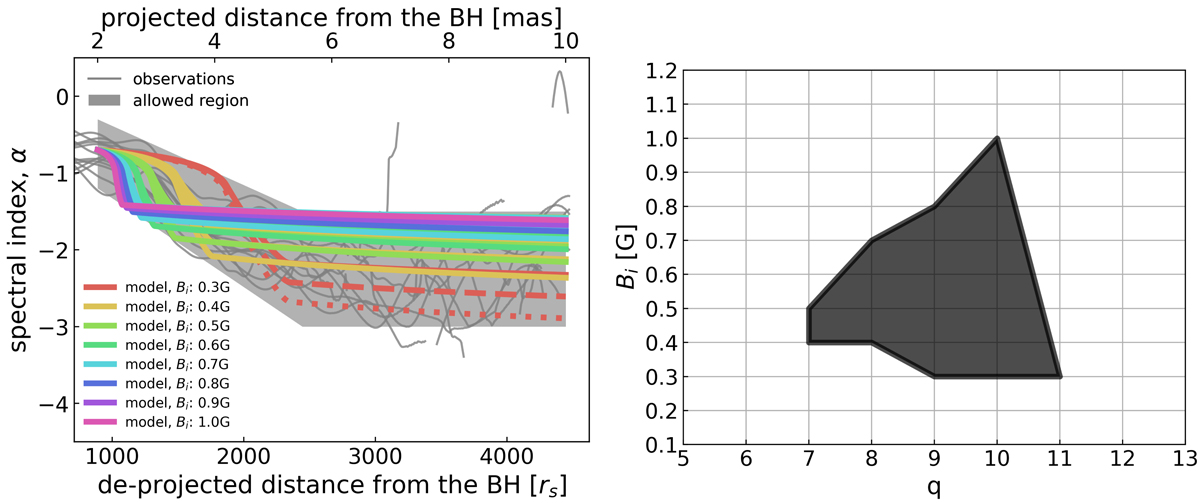
Fig. 4.
Download original image
Constraining the magnetic field strength and nonthermal electron injection of the M 87 jet. Left: Modeled spectral index distributions constrained by the observations. The distributions must lie in the gray shaded allowed region (see Sect. 4.4 for details). Colored lines are the modeled spectral index distributions. Different colors represent different initial magnetic field strengths, Bi. The dashed and dotted red line is a modeled spectrum index distribution with q = 10 and q = 11, respectively, with Bi = 0.3 G. Right: Parameter space (Bi, q). The black region is the allowed values of Bi and q constrained by the observations.
Current usage metrics show cumulative count of Article Views (full-text article views including HTML views, PDF and ePub downloads, according to the available data) and Abstracts Views on Vision4Press platform.
Data correspond to usage on the plateform after 2015. The current usage metrics is available 48-96 hours after online publication and is updated daily on week days.
Initial download of the metrics may take a while.