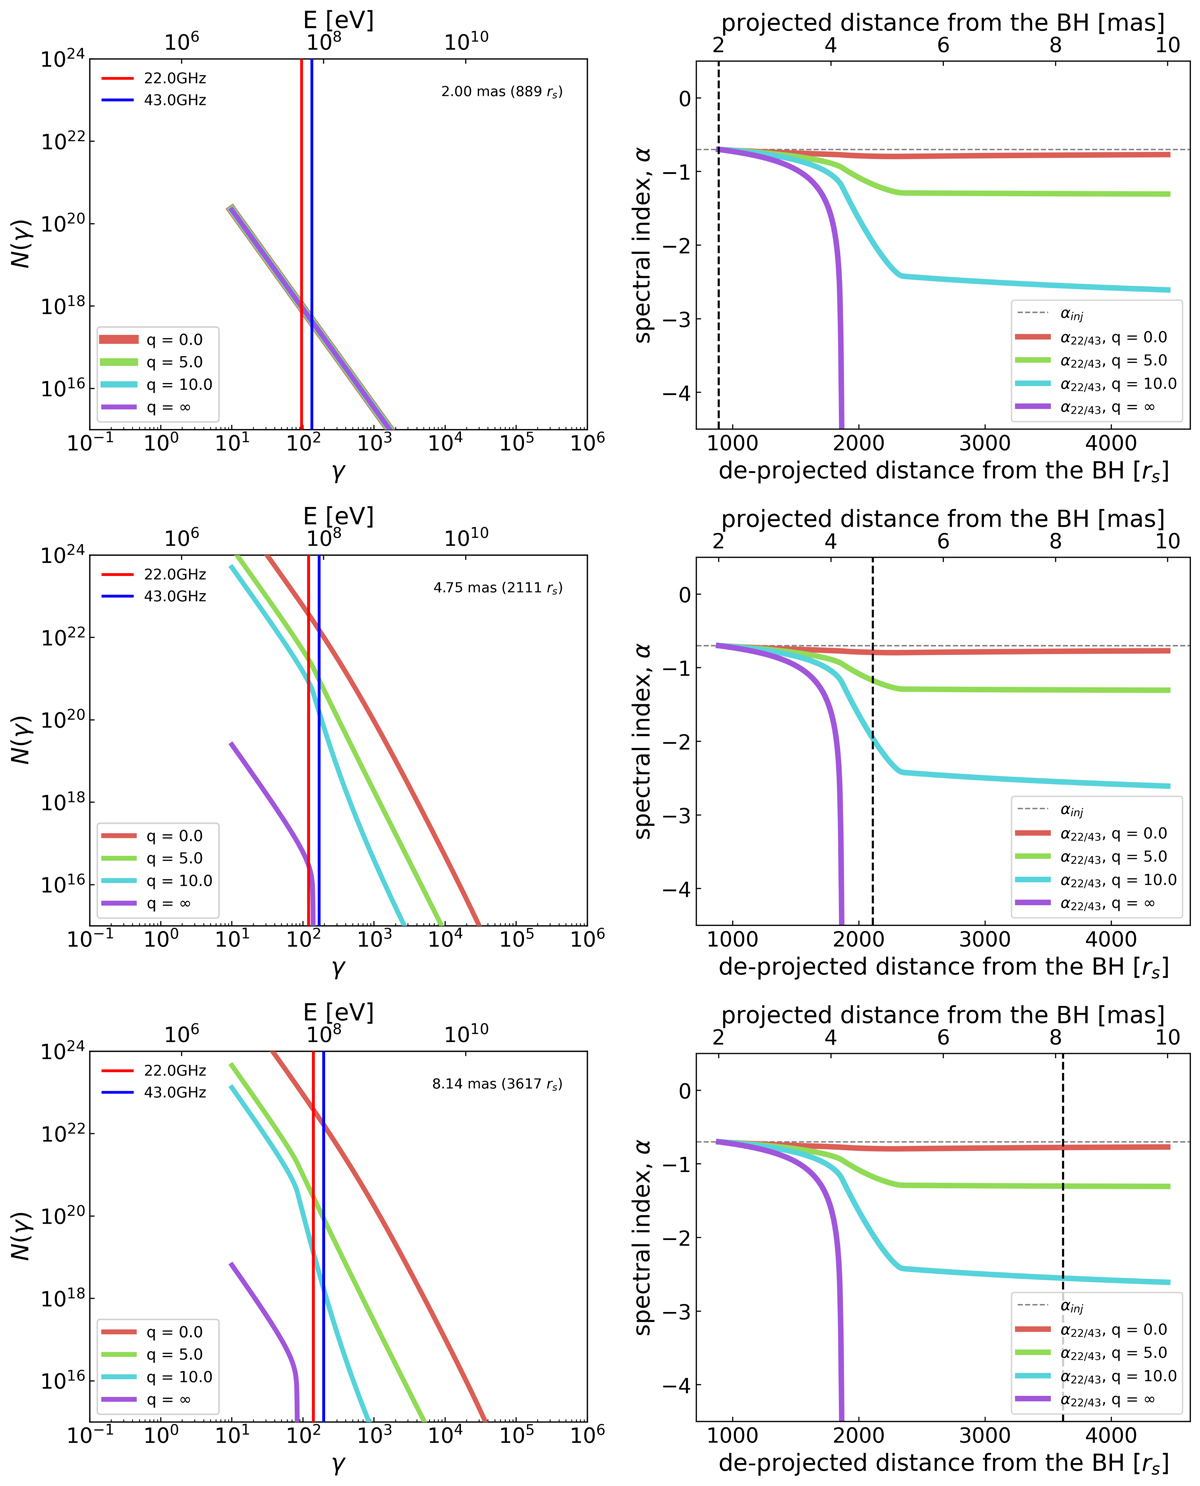
Fig. 3.
Download original image
Results of the modeled electron energy distributions (N(γ)) and the spectral index distributions as a function of distance along the jet. This is done to test the effect of the nonthermal electron injection rate in the jet. Left: Modeled electron number density distributions with different values of q = 0, 5, 10, and ∞. The different colors represent different values of q in the model: q = 0 represents continuous new electron injections in the jet, q = ∞ no new electron injections in the jet, and q = 5 and 10 new electrons injected into the jet but the volume decreases with distance. In all cases, we set the same magnetic field distribution (Bi = 0.3 G). The slope of the nonthermal electron injection is pinj = −2.4. The vertical red and blue lines represent the energies of the nonthermal electrons, which emit at 22 and 43 GHz. The location down the jet where the calculations were made is written in the top right corner. Right: Modeled spectral index distributions as a function of distance, which correspond to the slope of the electron number density distributions between the vertical lines in the left panel. The vertical dashed black line is the location down the jet where the calculations were made. The horizontal dashed line is the slope of the injection function (αinj = −0.7). An animation of this figure is available.
Current usage metrics show cumulative count of Article Views (full-text article views including HTML views, PDF and ePub downloads, according to the available data) and Abstracts Views on Vision4Press platform.
Data correspond to usage on the plateform after 2015. The current usage metrics is available 48-96 hours after online publication and is updated daily on week days.
Initial download of the metrics may take a while.