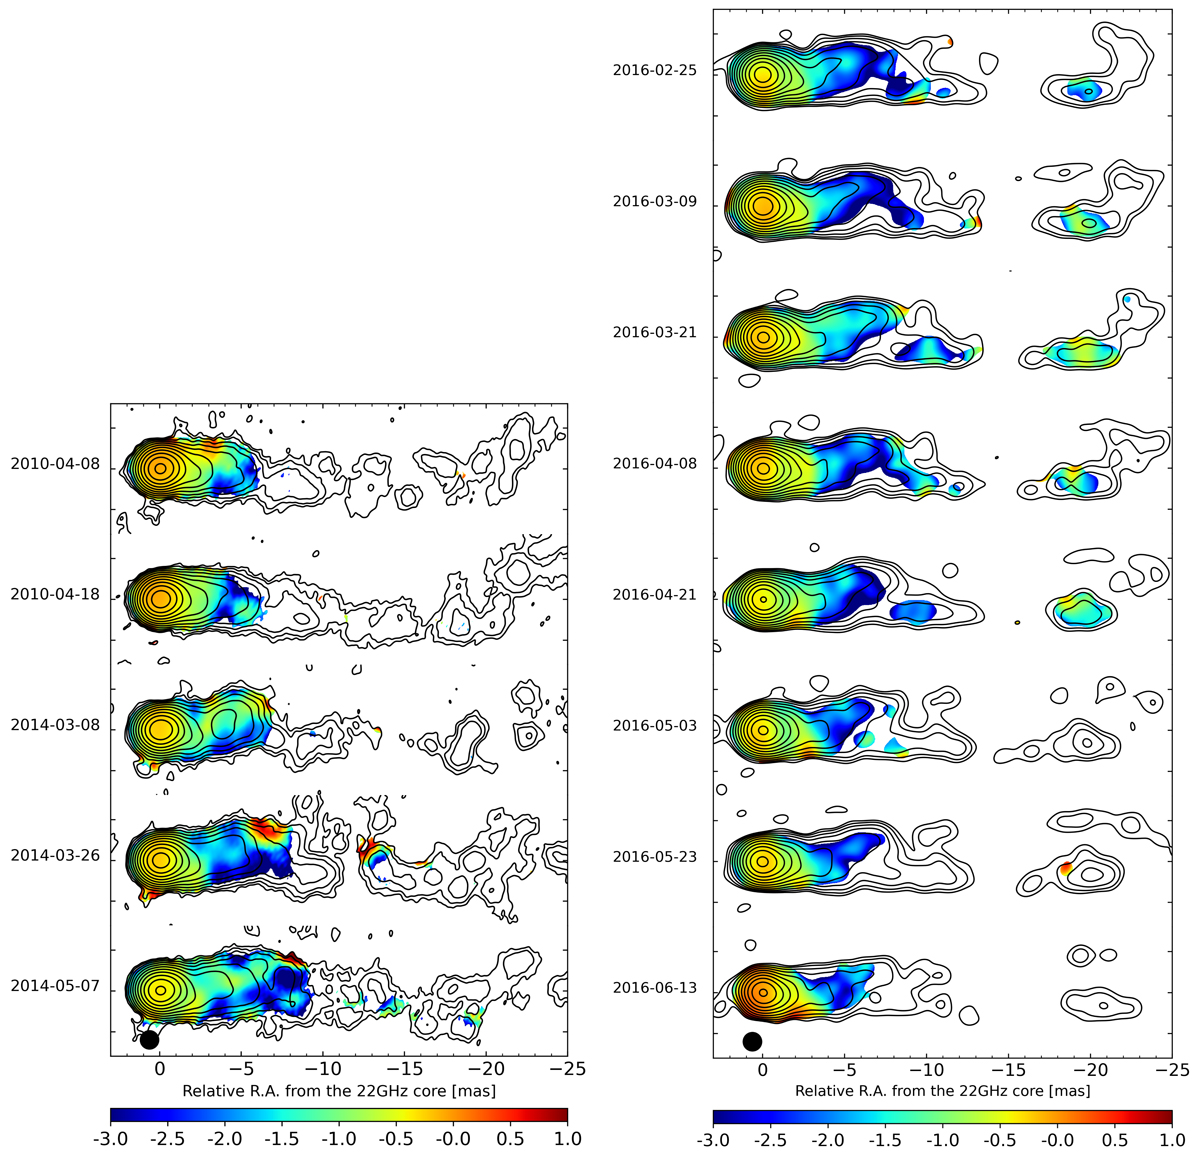
Fig. 1.
Download original image
Spectral index maps between 22 and 43 GHz obtained from VLBA and KaVA observations. All images have been rotated by −18°. The restoring beam size is 1.2 mas × 1.2 mas, drawn as a black circle in the bottom-left corner. Observing dates are shown to the left of each map. The contours represent the total intensity at 22 GHz. Contours start at 3σrms, increasing in steps of 2.
Current usage metrics show cumulative count of Article Views (full-text article views including HTML views, PDF and ePub downloads, according to the available data) and Abstracts Views on Vision4Press platform.
Data correspond to usage on the plateform after 2015. The current usage metrics is available 48-96 hours after online publication and is updated daily on week days.
Initial download of the metrics may take a while.