Fig. 11
Download original image
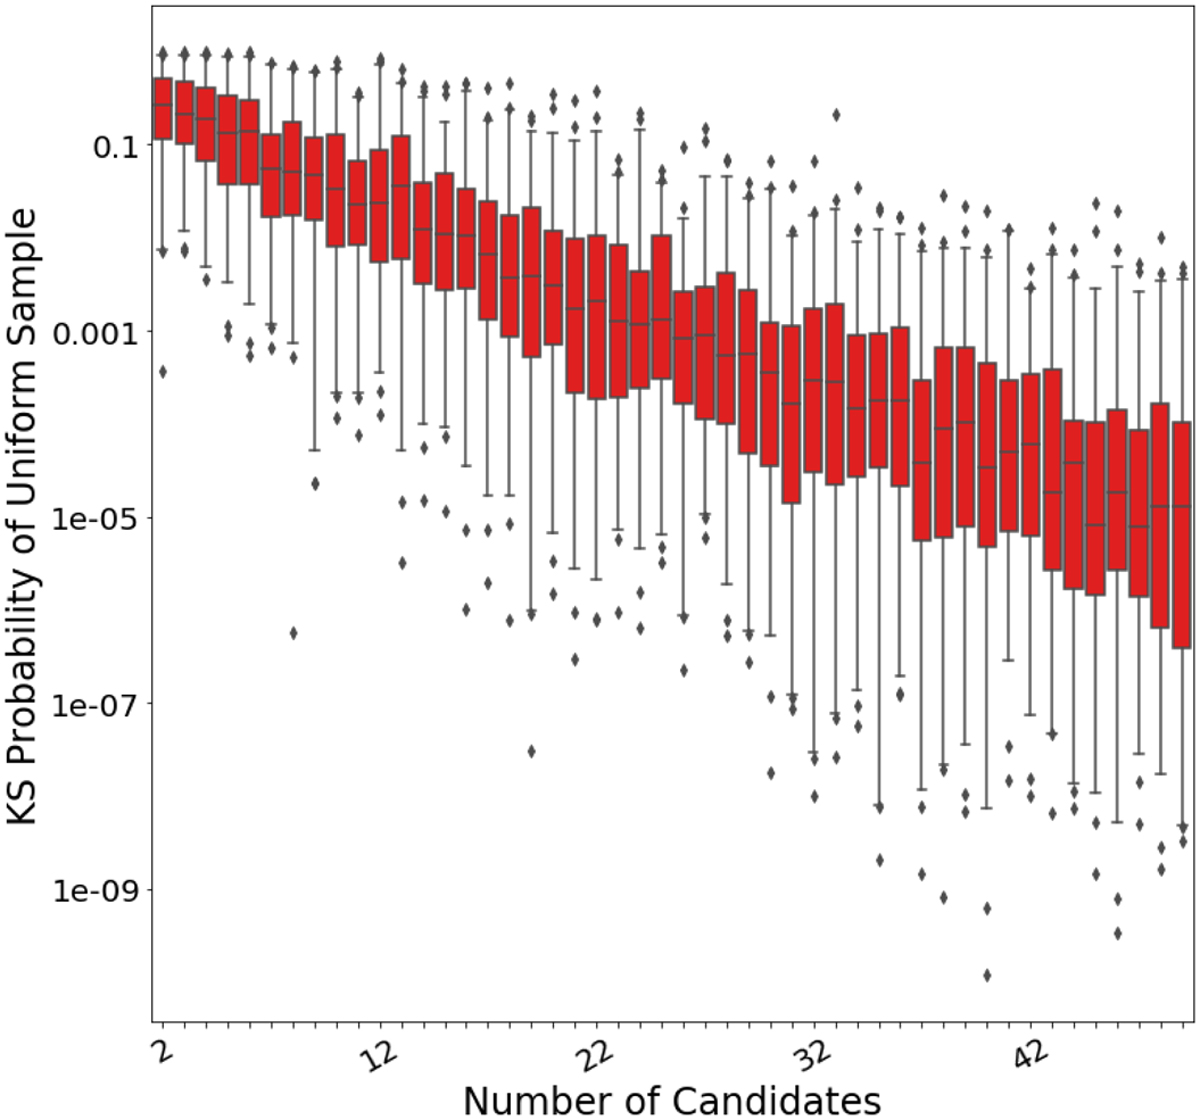
Box-and-whiskers plot of the distribution of the Kolmogorov-Smirnov statistics comparing astrophysical detections to sky-uniform detections, with 100 realisations of surveys of the MIOSOTYS survey area that report N candidate detections for N from 2 to 50. The red boxes contain 50% of the data points, and the whiskers contain 96% of the data points, which the other trials plotted as outlier points.
Current usage metrics show cumulative count of Article Views (full-text article views including HTML views, PDF and ePub downloads, according to the available data) and Abstracts Views on Vision4Press platform.
Data correspond to usage on the plateform after 2015. The current usage metrics is available 48-96 hours after online publication and is updated daily on week days.
Initial download of the metrics may take a while.