Fig. C.1
Download original image
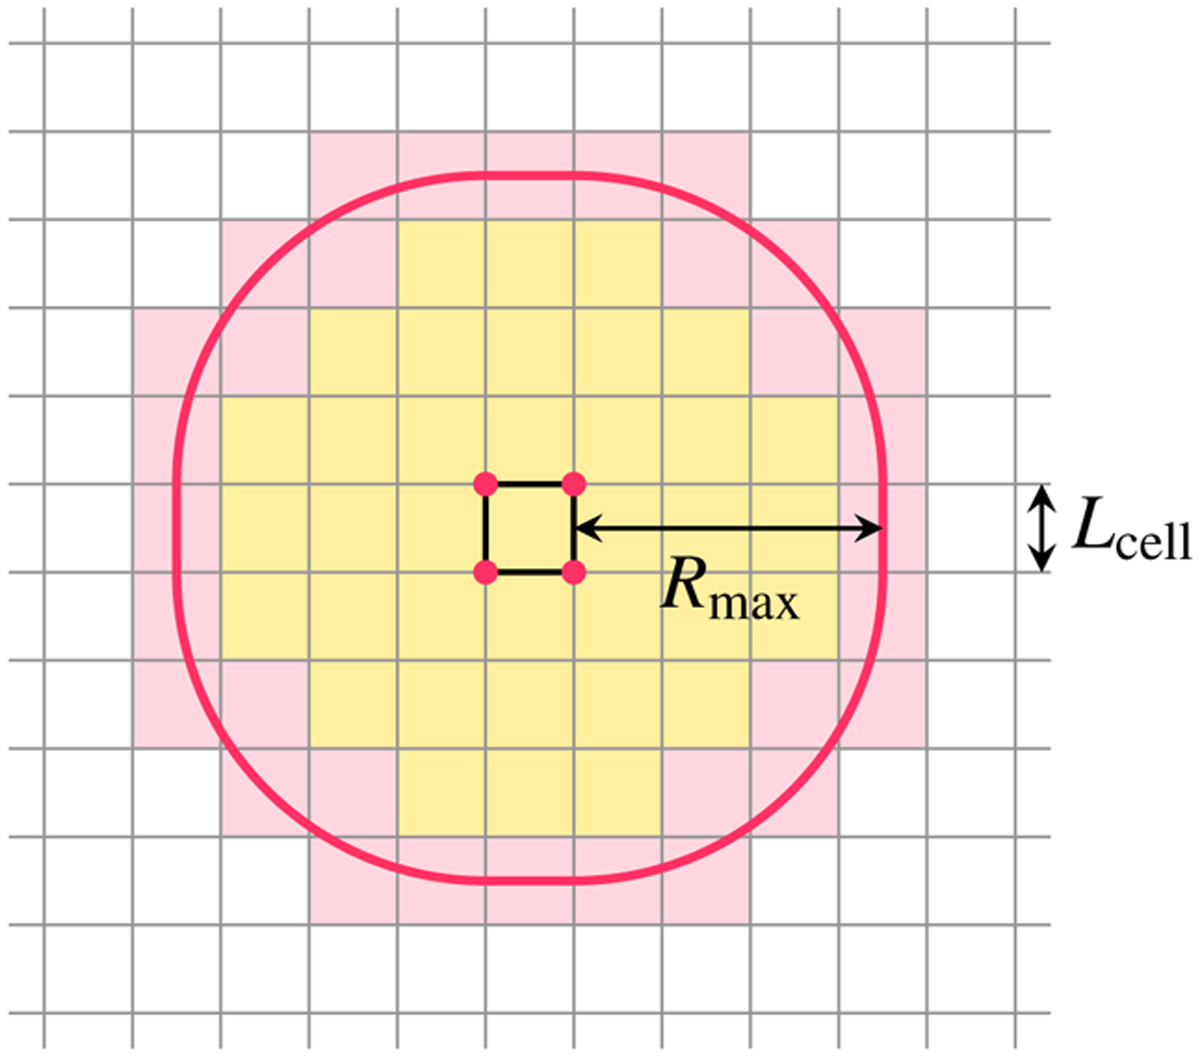
Grid cells to be visited (coloured areas) for a reference cell (black square) and an isotropic query range with a radius of Rmax. Yellow regions indicate cells that are entirely inside the query range, and pink zones denote cells that intersect the boundary of the query range, which is shown in red. The side length of every cell is denoted by Lcell.
Current usage metrics show cumulative count of Article Views (full-text article views including HTML views, PDF and ePub downloads, according to the available data) and Abstracts Views on Vision4Press platform.
Data correspond to usage on the plateform after 2015. The current usage metrics is available 48-96 hours after online publication and is updated daily on week days.
Initial download of the metrics may take a while.