Fig. 8.
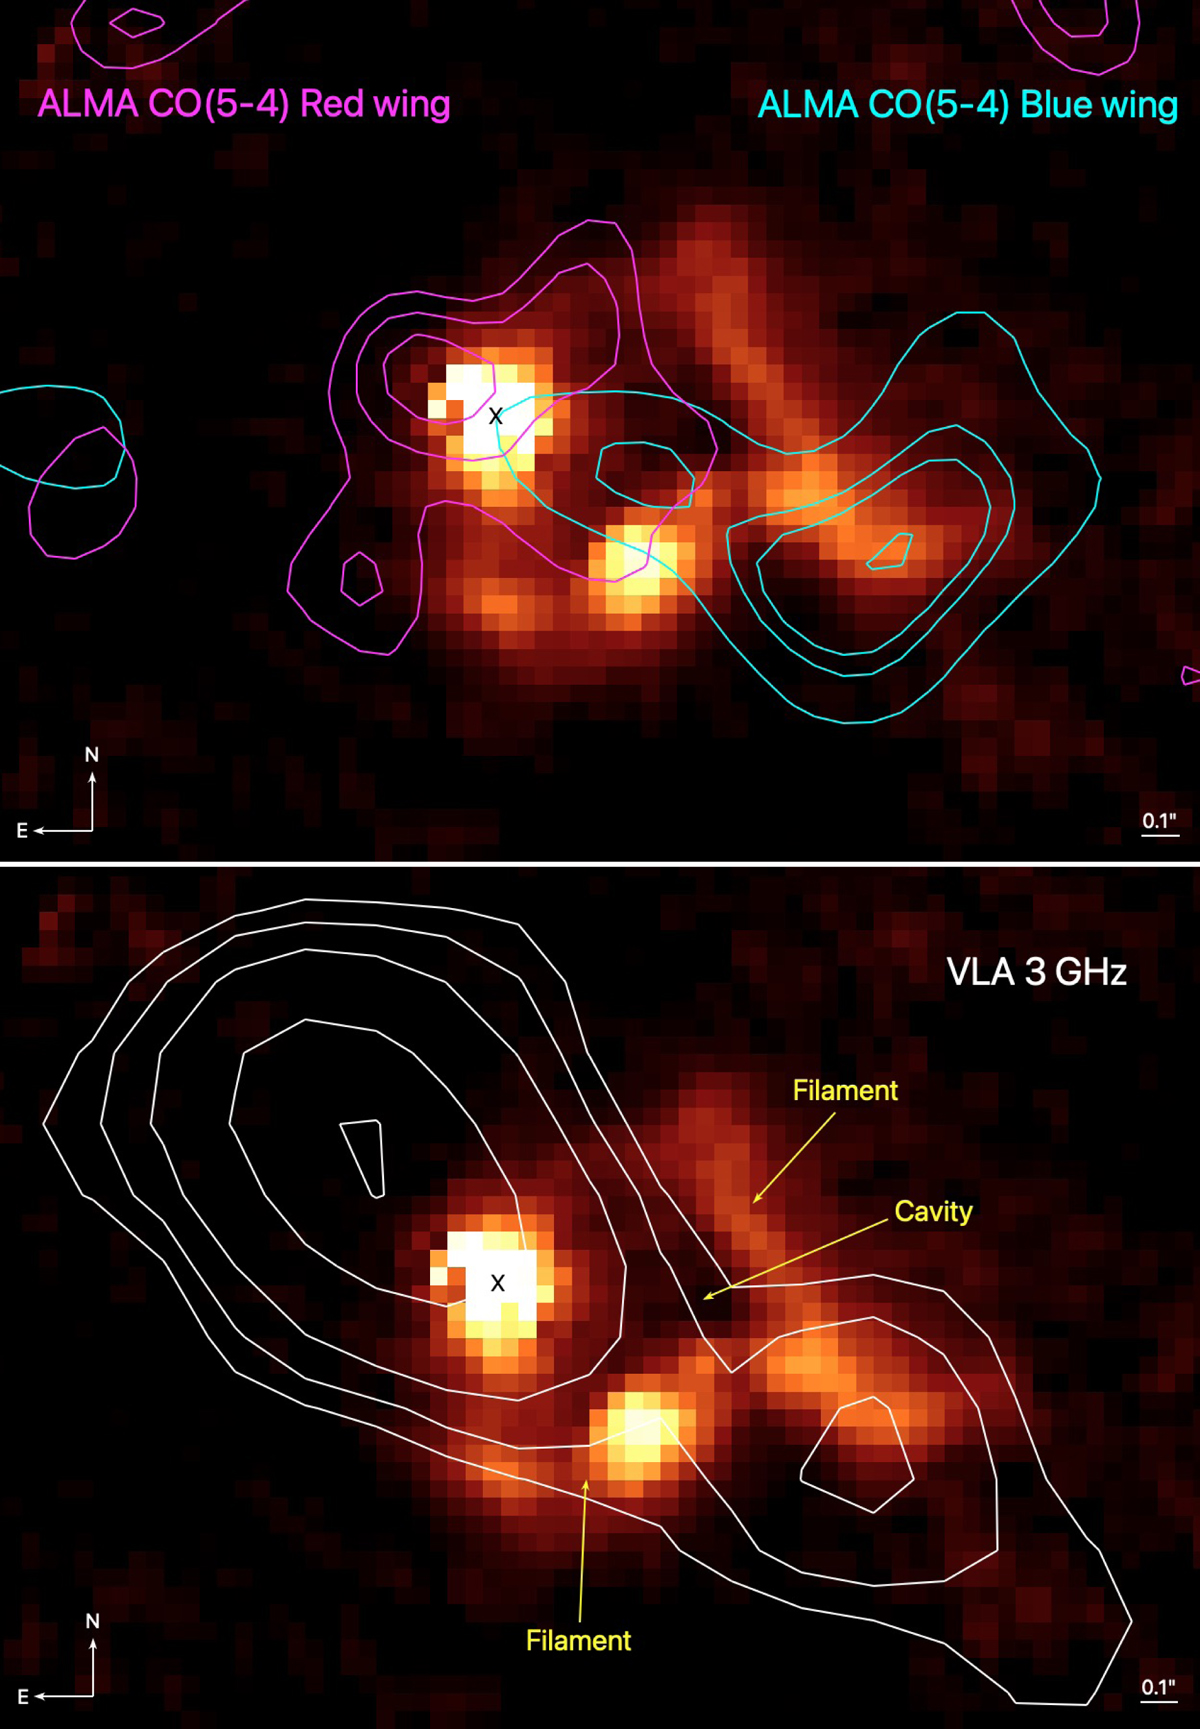
Download original image
Channel map of [OIII]λ5007 emission with v < −300 km s−1 with contours of the CO(5−4) molecular blue- (cyan) and redshifted (magenta) outflow components (upper panel, from B18), and 3 GHz radio emission (white) from VLA observations (lower panel, from Vardoulaki et al. 2019). The location of the QSO is marked with a black cross, and the filaments and the cavity are shown with arrows. The VLA radio emission and the blueshifted ionised and molecular outflows appear to be co-spatial, as well as the possible redshifted counterparts.
Current usage metrics show cumulative count of Article Views (full-text article views including HTML views, PDF and ePub downloads, according to the available data) and Abstracts Views on Vision4Press platform.
Data correspond to usage on the plateform after 2015. The current usage metrics is available 48-96 hours after online publication and is updated daily on week days.
Initial download of the metrics may take a while.