Fig. 7.
Download original image
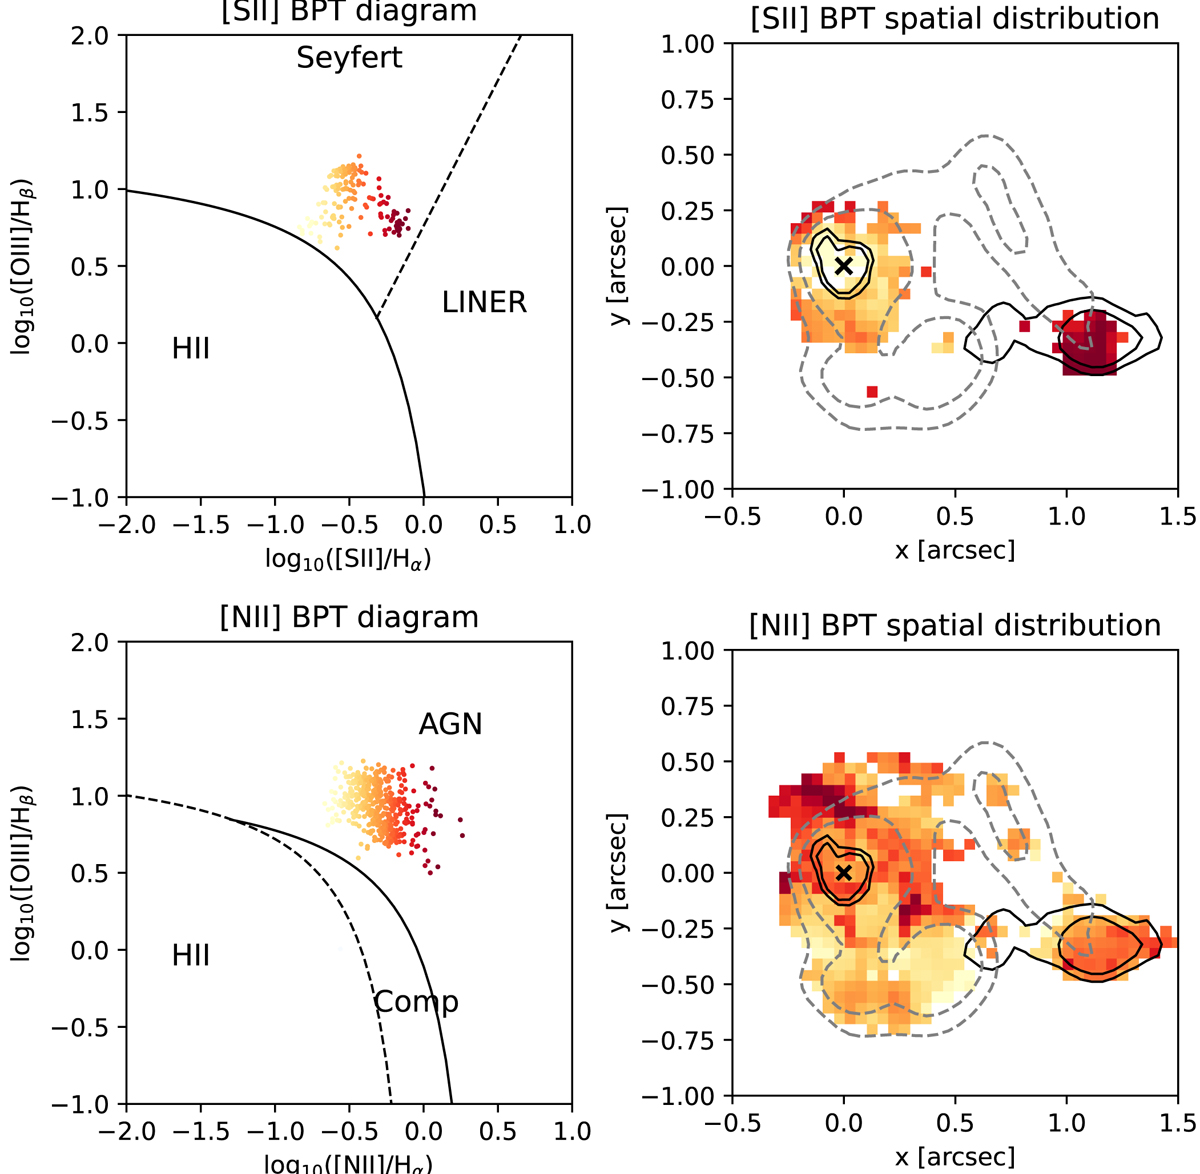
Resolved [SII]–BPT (upper panels) and [NII]–BPT (lower panels) diagrams for each spaxel with S/N > 3 in each line. The data points in the BPT diagrams (left panels) are colour coded as a function of their [SII]/Hα and [NII]/Hα ratios for the [SII]–BPT and [NII]–BPT, respectively. The same colours are used in the corresponding maps (right panels), where the contours shown in Fig. 4 are overplotted. The QSO location is marked with a black cross.
Current usage metrics show cumulative count of Article Views (full-text article views including HTML views, PDF and ePub downloads, according to the available data) and Abstracts Views on Vision4Press platform.
Data correspond to usage on the plateform after 2015. The current usage metrics is available 48-96 hours after online publication and is updated daily on week days.
Initial download of the metrics may take a while.