Open Access
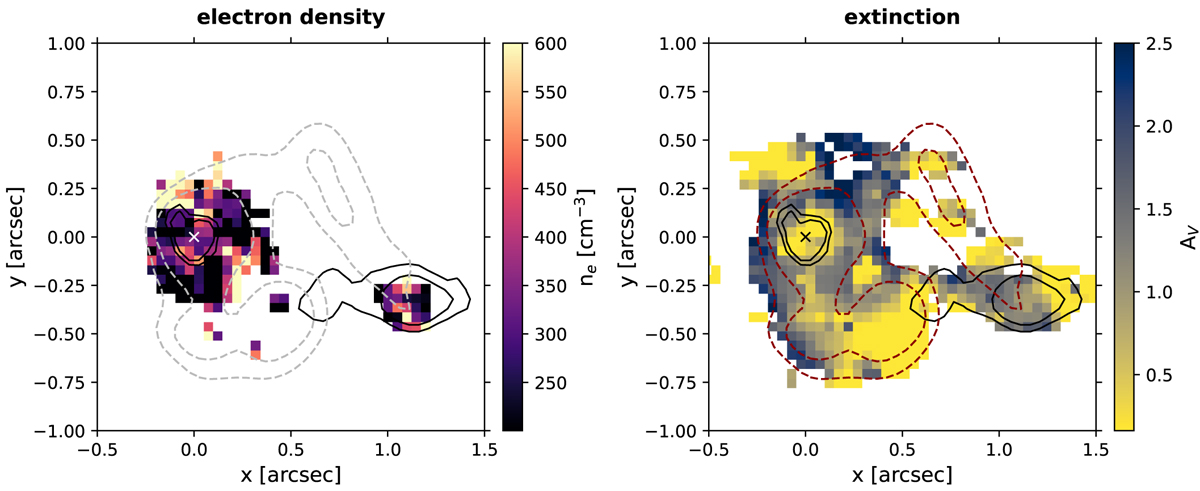
Fig. 6.
Download original image
Electron density map from [SII]λλ6716,30 line ratio (left panel) and extinction map from the Balmer decrement Hα/Hβ (right panel). The contours used in Fig. 4 are overplotted. Both maps display only the spaxels with at least S/N > 3 in all the emission lines involved, and the QSO location is marked with a cross.
Current usage metrics show cumulative count of Article Views (full-text article views including HTML views, PDF and ePub downloads, according to the available data) and Abstracts Views on Vision4Press platform.
Data correspond to usage on the plateform after 2015. The current usage metrics is available 48-96 hours after online publication and is updated daily on week days.
Initial download of the metrics may take a while.