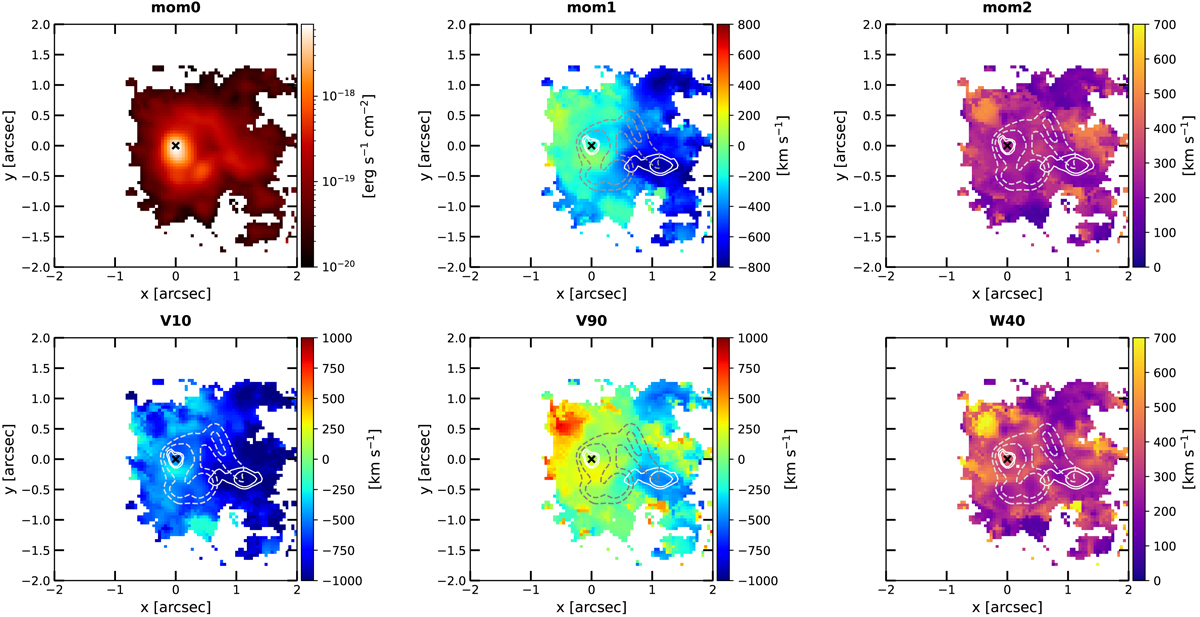
Fig. 4.
Download original image
Kinematics of the [OIII] line emission. The upper panels show moment 0, moment 1, and moment 2 of the whole line profile velocity. The lower panels instead show v10, the velocity at the 10th percentile of the overall emission-line profile in each spaxel, v90, the 90th percentile, and W40, i.e., W40 = v50 − v10, the line width containing 40% of the emission line flux. Solid contours represent 30% and 50% of the peak emission in the bluest channel map (v < −1000 km s−1) in Fig. 3, and the dashed contours the 5% and 10% emission of the third channel (−600 < v < −250 km s−1). The maps show the spaxel with S/N > 3 on the total [OIII] flux, and the cross marks the position of the QSO.
Current usage metrics show cumulative count of Article Views (full-text article views including HTML views, PDF and ePub downloads, according to the available data) and Abstracts Views on Vision4Press platform.
Data correspond to usage on the plateform after 2015. The current usage metrics is available 48-96 hours after online publication and is updated daily on week days.
Initial download of the metrics may take a while.