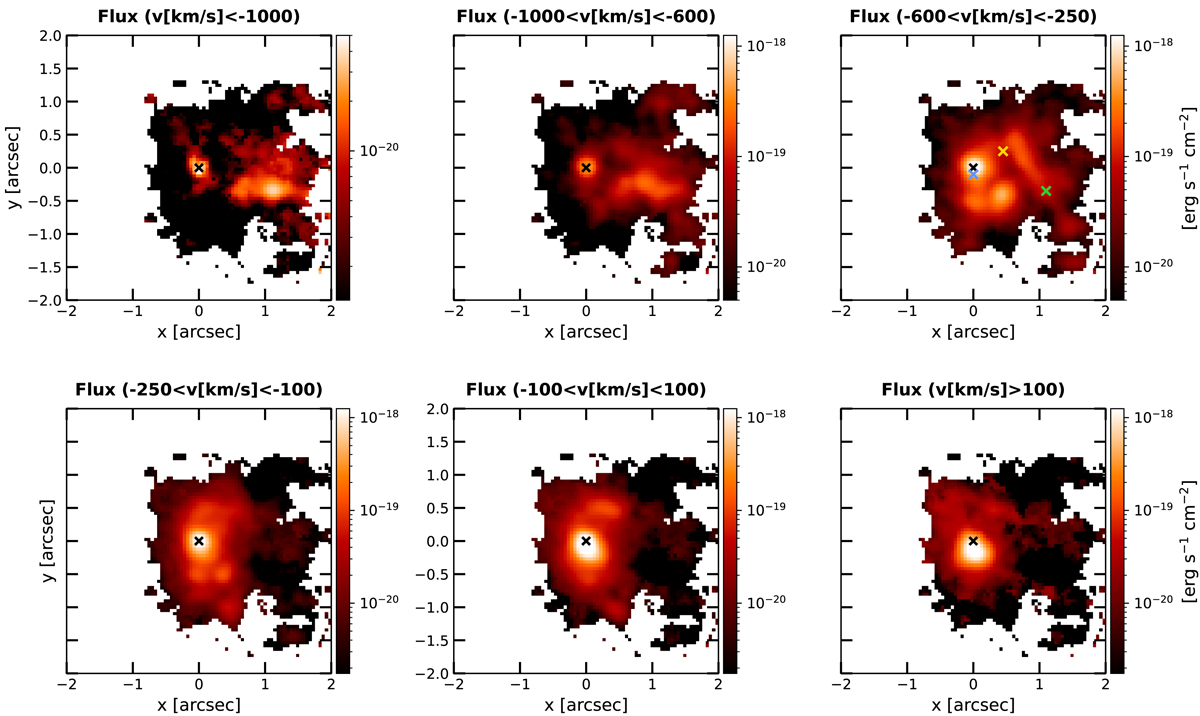
Fig. 3.
Download original image
Channel maps for the [OIII]λ5007 line emission. The six panels show the [OIII] line flux in different velocity bins. In the upper left panel, the highest blueshifted velocities are shown, highlighting the fastest part of the wind. In the following panels, the filaments connecting the outflow to the quasar location become evident. In contrast, the lower right panel shows the possible redshifted outflow emission to the north-east. The maps show the spaxel with S/N > 3 on the total [OIII] flux. At the distance of the target, the scale is ∼8.5 kpc/″. The coloured crosses show the location of the extraction spaxels for the spectra shown in Fig. 2.
Current usage metrics show cumulative count of Article Views (full-text article views including HTML views, PDF and ePub downloads, according to the available data) and Abstracts Views on Vision4Press platform.
Data correspond to usage on the plateform after 2015. The current usage metrics is available 48-96 hours after online publication and is updated daily on week days.
Initial download of the metrics may take a while.