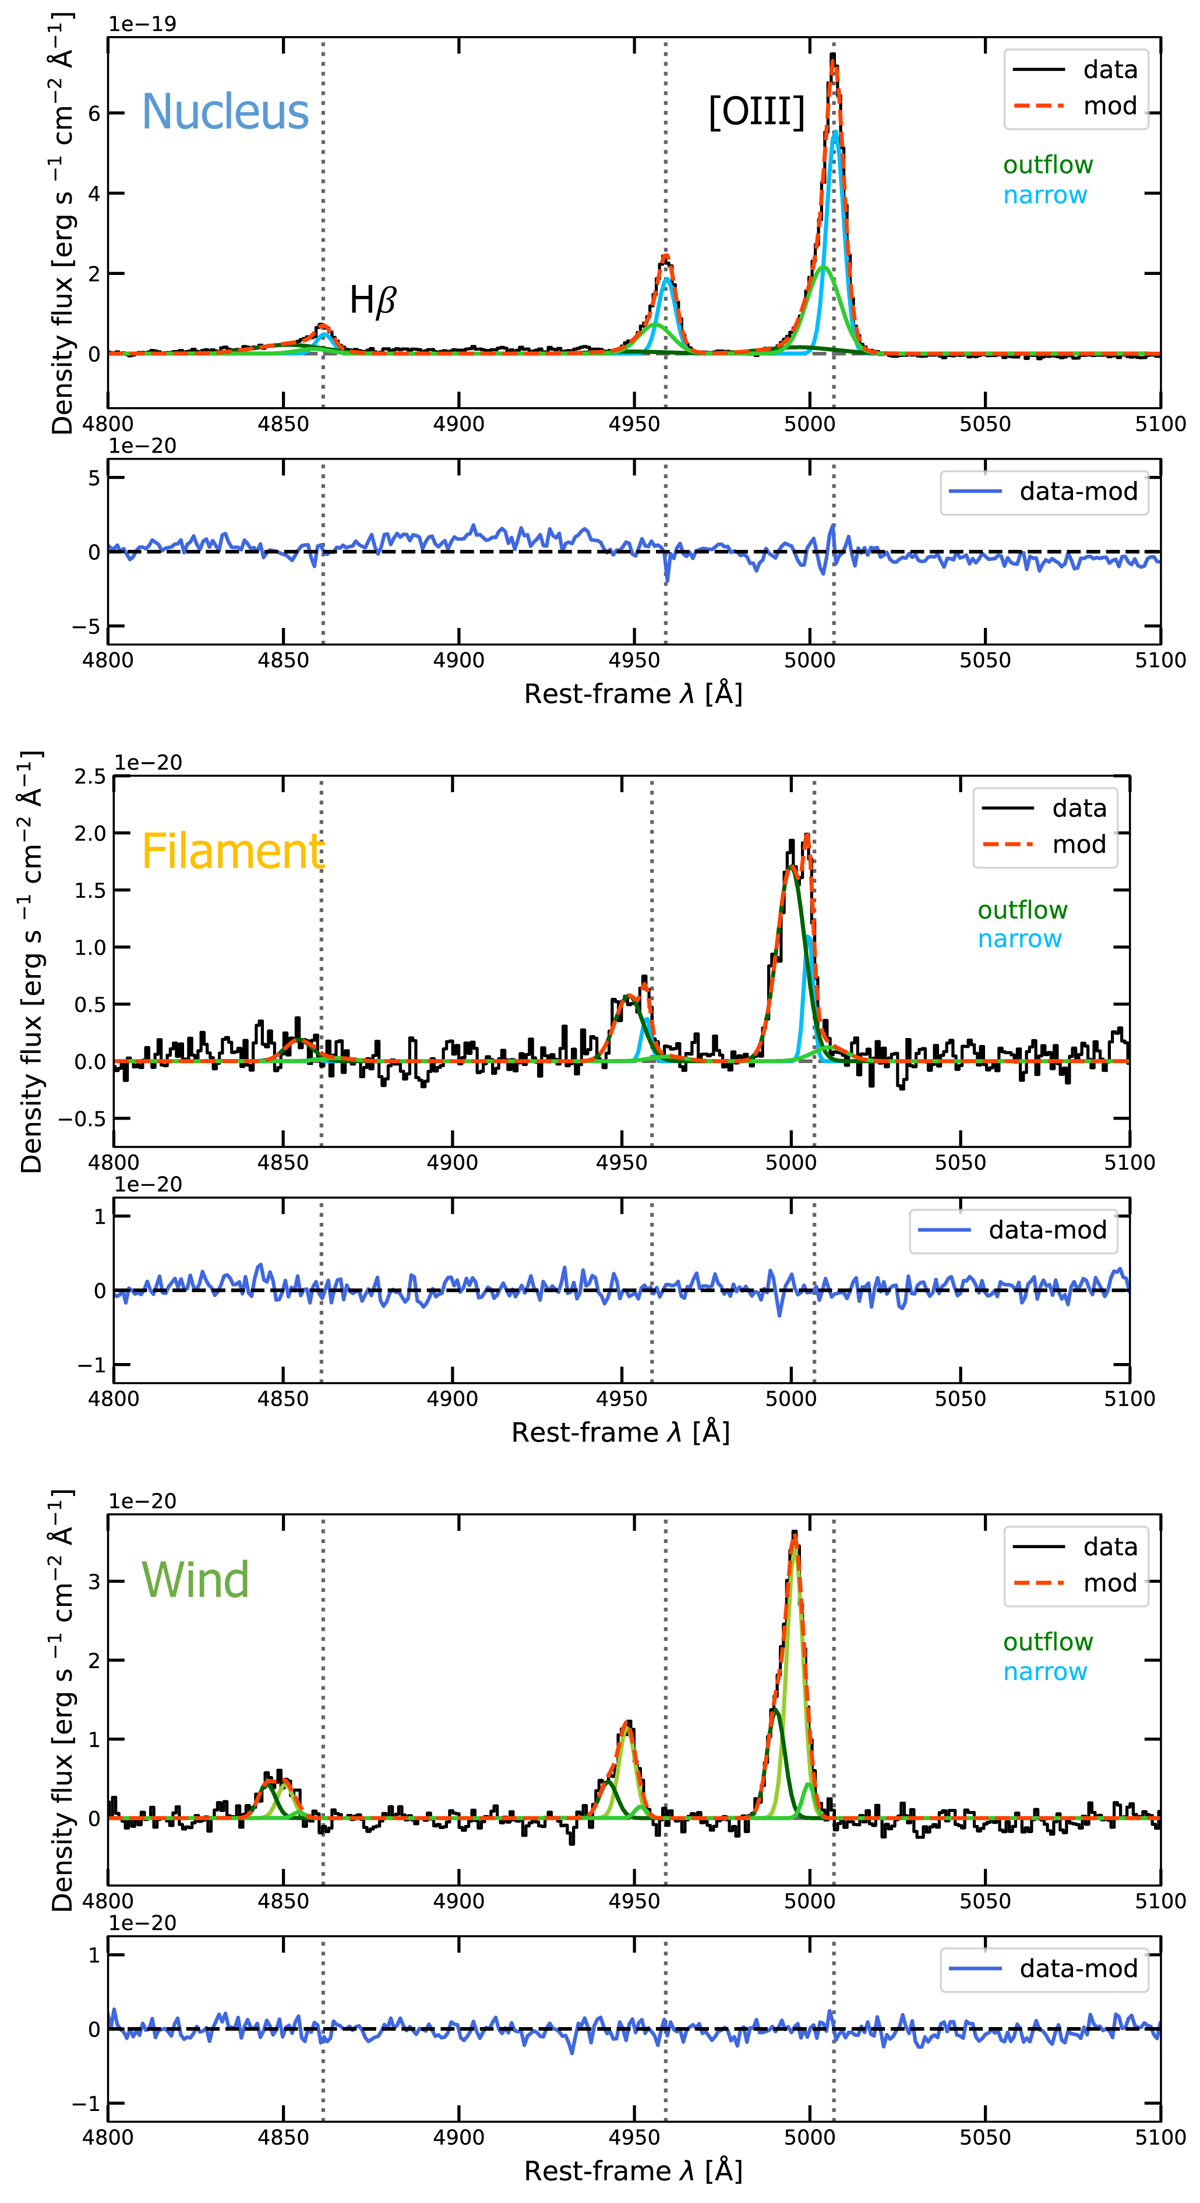
Fig. 2.
Download original image
Representative examples of our multi-component fitting of Hβ and [OIII] emission lines in single spaxels from three different regions of the galaxy, as marked with coloured crosses in Fig. 3. From the top, the panels refer to a nuclear region spaxel, to a filament spaxel (see text), and to a spaxel in the most blueshifted wind region, respectively. The NIRSpec data are shown in black, the best-fitting systemic narrow components are shown in cyan, and the Gaussian components used to reproduce the outflow are shown with different tones of green. We classified the Gaussian components in each spaxel with a velocity shift |v|< 300 km s−1 (with respect to the systemic velocity of the QSO, marked with a dotted line) and σ < 300 km s−1 as narrow (see Sects. 3.2 and 3.6.1). Systemic narrow line emission dominates in the nucleus and becomes fainter along the filaments, while only outflow emission is detected in the wind region (see Sect. 3.1). Residuals of the emission-line fitting are shown in blue in a sub-panel for all regions.
Current usage metrics show cumulative count of Article Views (full-text article views including HTML views, PDF and ePub downloads, according to the available data) and Abstracts Views on Vision4Press platform.
Data correspond to usage on the plateform after 2015. The current usage metrics is available 48-96 hours after online publication and is updated daily on week days.
Initial download of the metrics may take a while.