Fig. 10.
Download original image
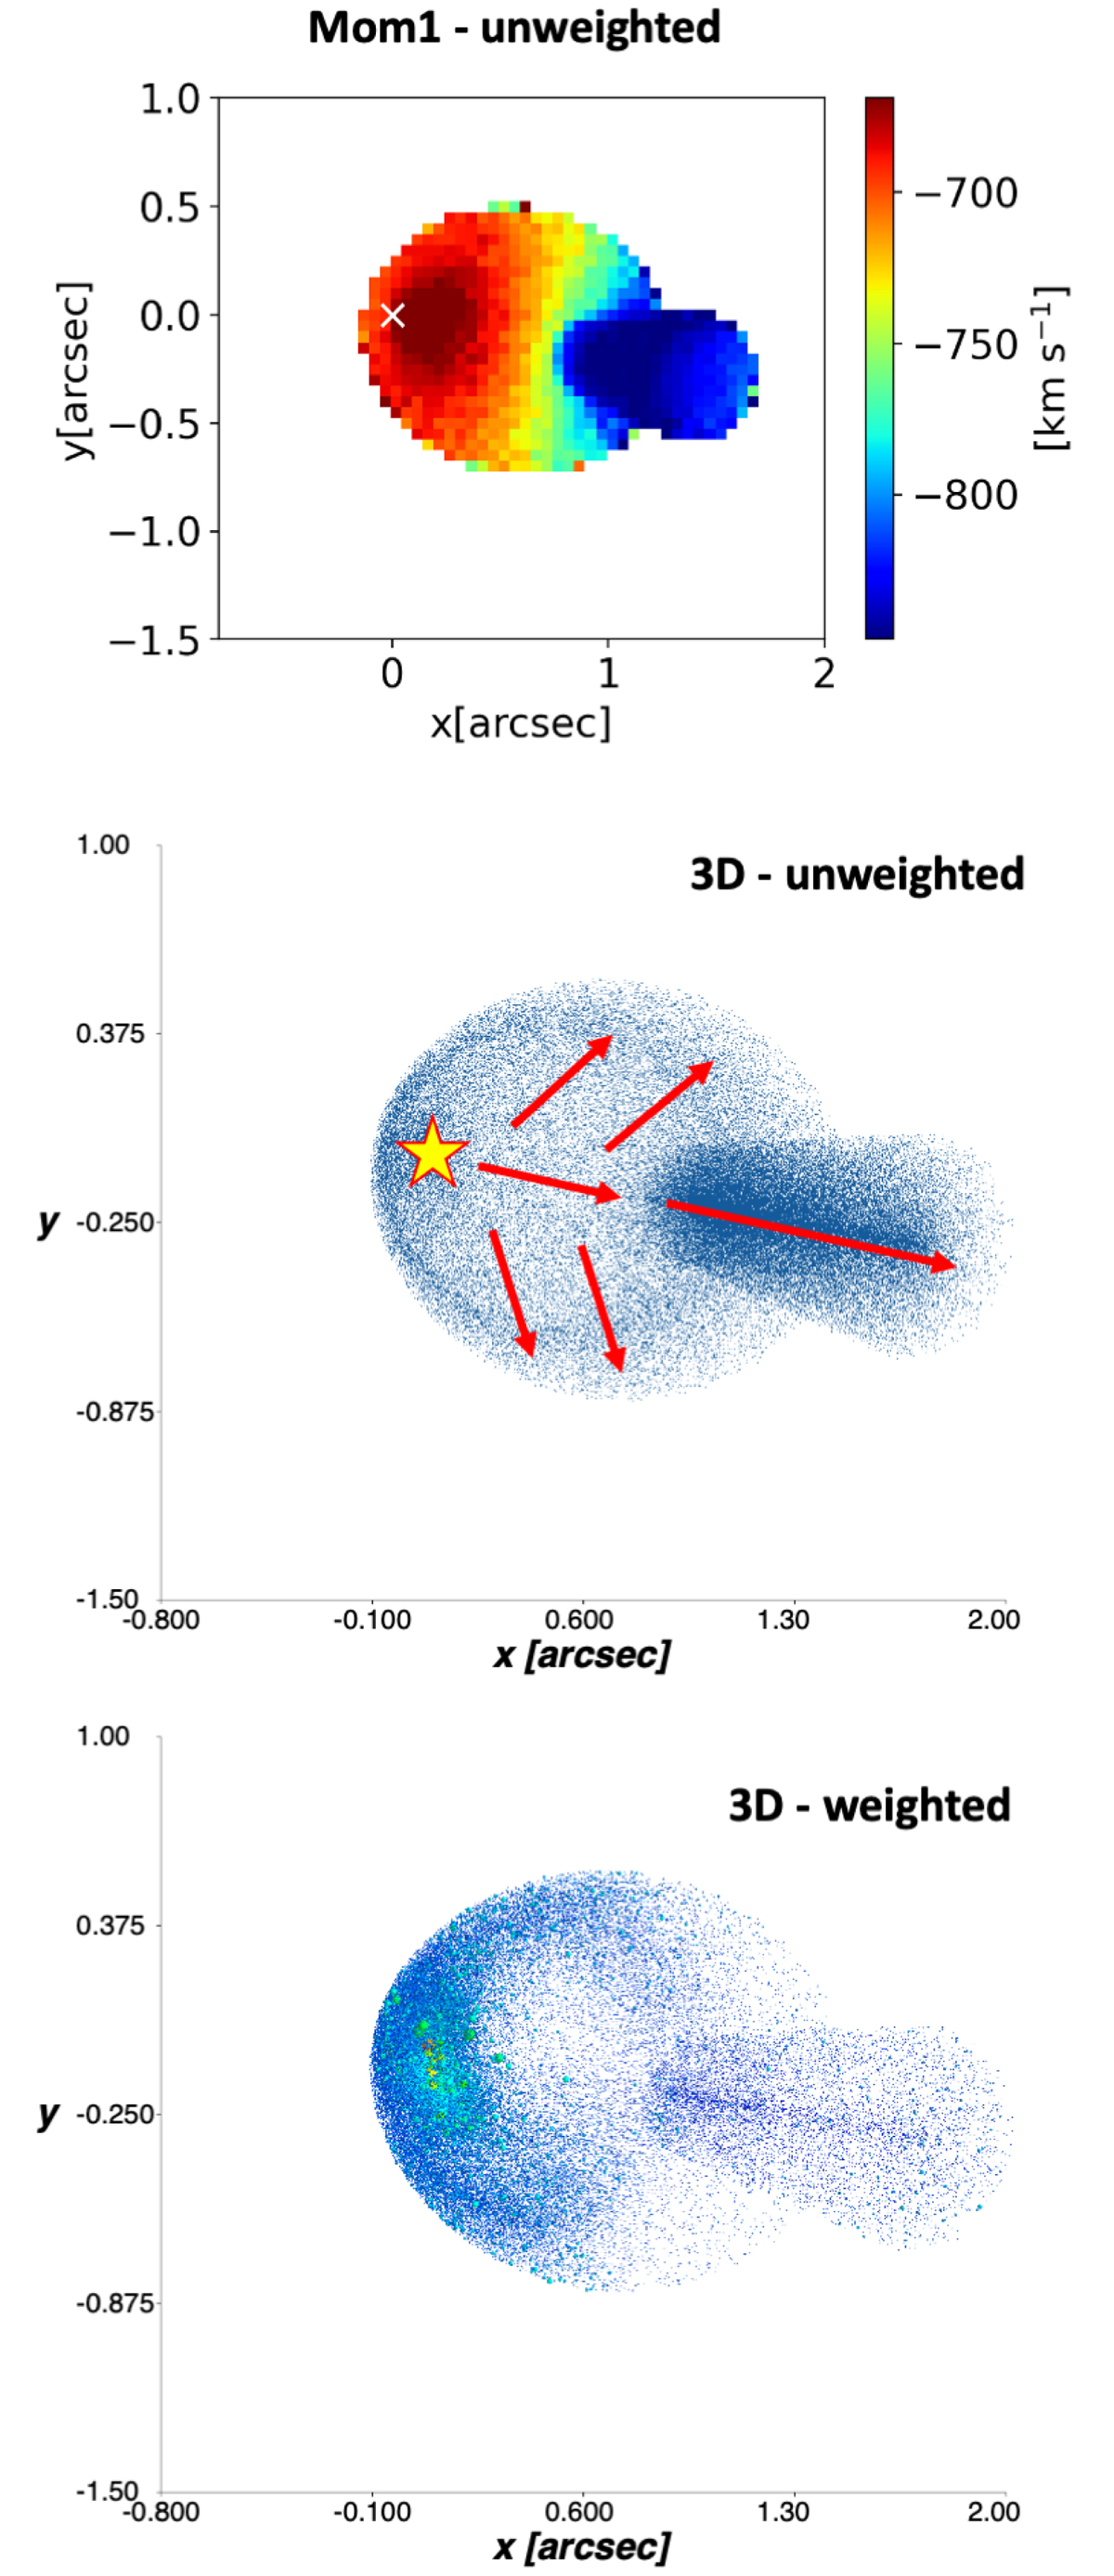
Best-fitting MOKA3D model used to reproduce the XID2028 bubble+jet kinematics in Fig. 9. Upper panel: projected unweighted moment 1 map. Middle panel: 3D unweighted model, i.e. the intrinsic cloud distribution before weighting them on the observed datacube. A schematic 3D view of the assumed toy-model geometry and kinematics is superposed. The QSO position is shown with a star, and the arrows show the outflow direction together with the expansion velocity that inflates the bubble (see text). Lower panel: 3D model. Each cloud is weighted based on the observed flux for its location and velocity in the data.
Current usage metrics show cumulative count of Article Views (full-text article views including HTML views, PDF and ePub downloads, according to the available data) and Abstracts Views on Vision4Press platform.
Data correspond to usage on the plateform after 2015. The current usage metrics is available 48-96 hours after online publication and is updated daily on week days.
Initial download of the metrics may take a while.