Fig. 8.
Download original image
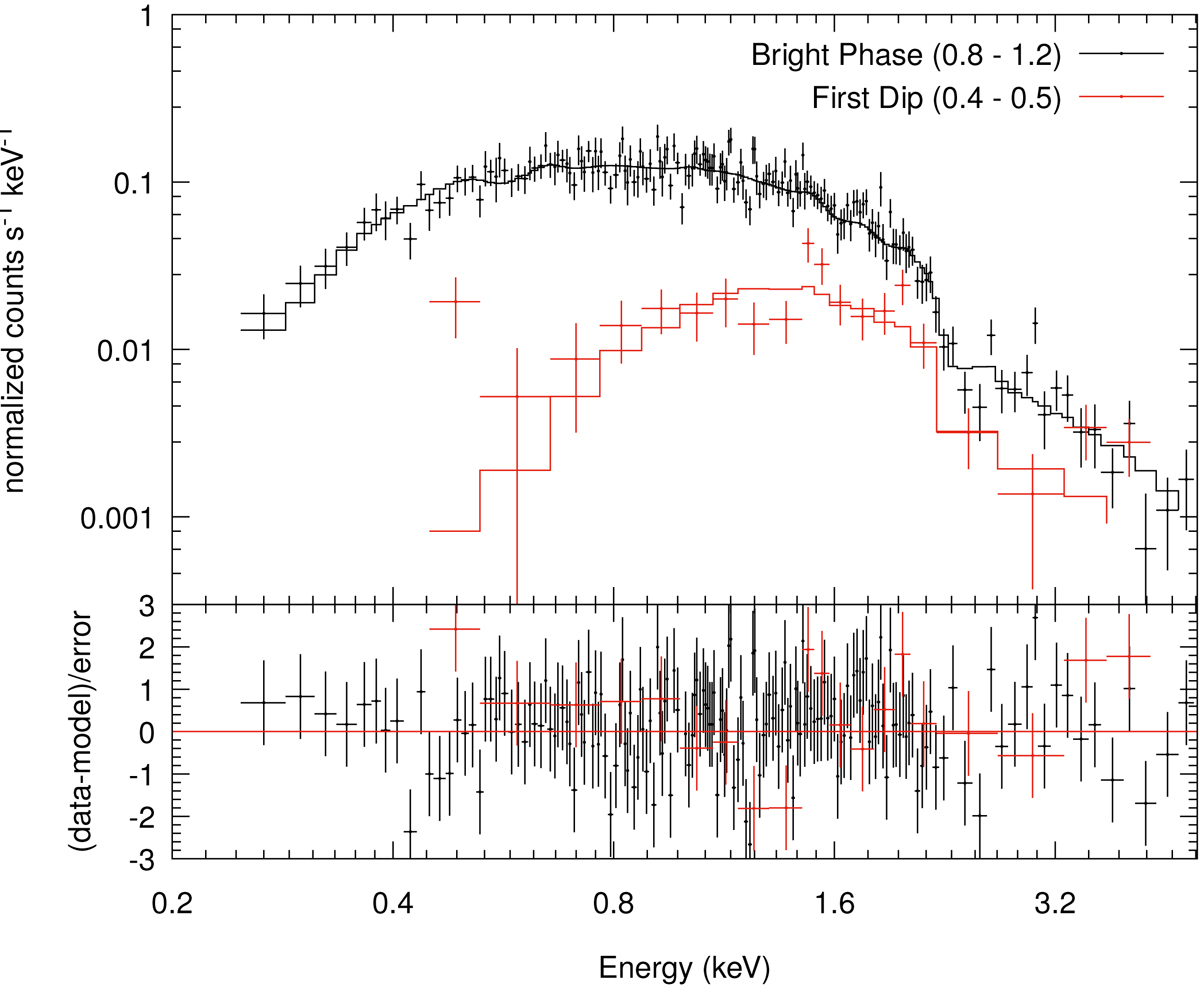
Phase-resolved X-ray spectra of the SRGE0758. The black data points represent the bright phase spectrum and were extracted for the phase interval 0.8 − 1.2. The black line shows the model fit with a reduced chi-square value of 1.02 (χ = 171 for 168 d.o.f.). The spectrum of the first dip (shown with red data points) was obtained from the phase at 0.4 − 0.5. The fit revealed a reduced χ2 of 1.51 (χ = 30 for 20 d.o.f.).
Current usage metrics show cumulative count of Article Views (full-text article views including HTML views, PDF and ePub downloads, according to the available data) and Abstracts Views on Vision4Press platform.
Data correspond to usage on the plateform after 2015. The current usage metrics is available 48-96 hours after online publication and is updated daily on week days.
Initial download of the metrics may take a while.