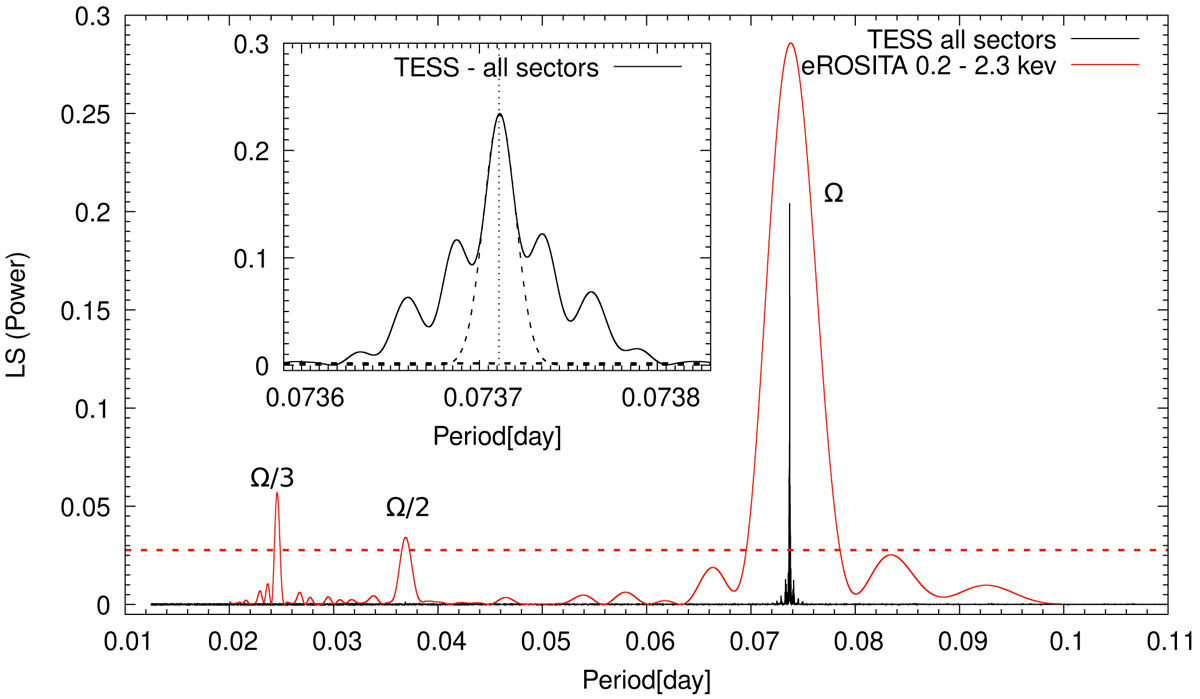
Fig. 4.
Download original image
Lomb-Scargle periodogram of the TESS and eROSITA observations. The main figure shows the over plotted power spectra of the object obtained from TESS and eROSITA, and the inset details the main peak of the TESS observations. The dashed black line shows a Gaussian line fit to the main peak. The red dashed line in the main frame gives the 99% significance level of the eROSITA power spectrum. The main period and its harmonics are indicated with the Ω symbol. The horizontal black dashed line within the inset indicates the 99% significance level for the TESS spectrum.
Current usage metrics show cumulative count of Article Views (full-text article views including HTML views, PDF and ePub downloads, according to the available data) and Abstracts Views on Vision4Press platform.
Data correspond to usage on the plateform after 2015. The current usage metrics is available 48-96 hours after online publication and is updated daily on week days.
Initial download of the metrics may take a while.