Fig. 7
Download original image
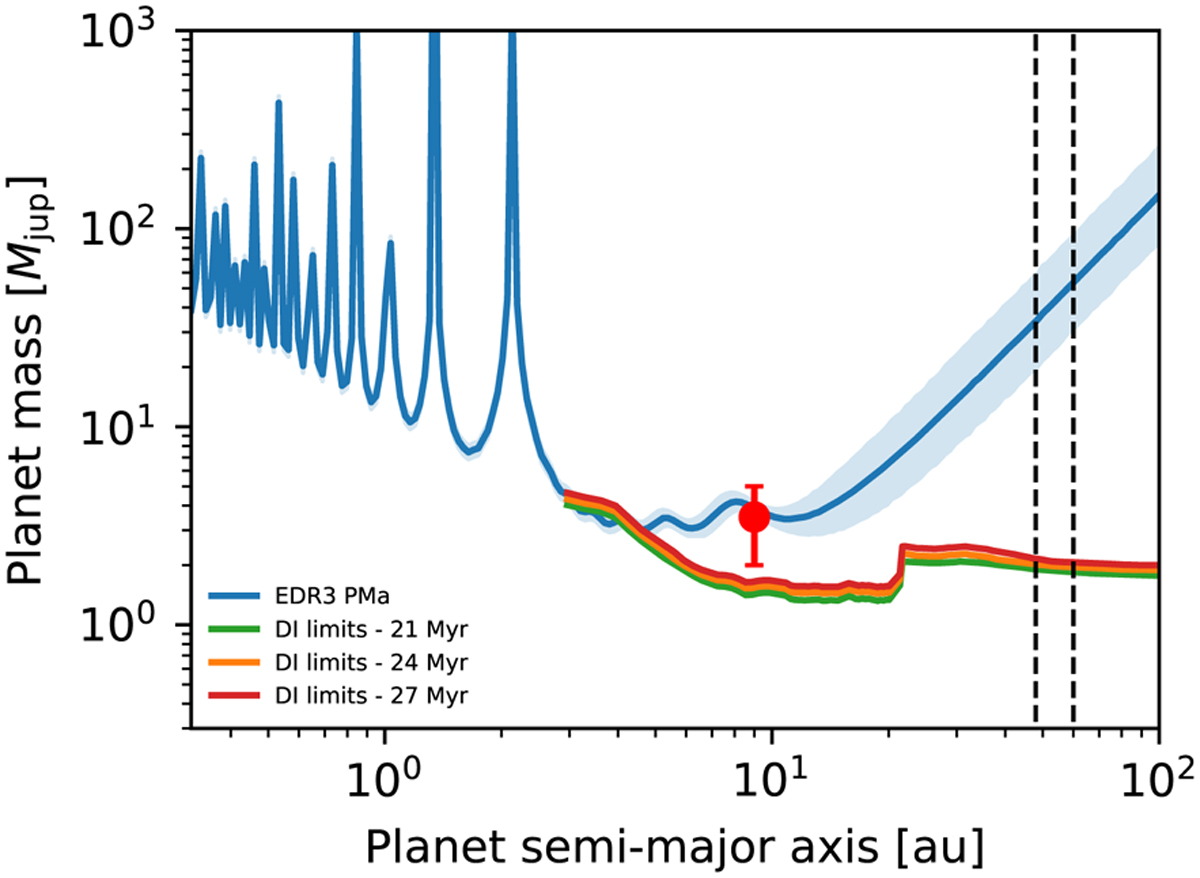
Comparison of the direct imaging results obtained from the SPHERE observations with the PMa results. The solid blue line represents the mass of the object causing the PMa signal as a function of the separation from the host star. The shaded blue area represents the 1σ confidence interval for this measure. The mass limits obtained from the SPHERE observations for the minimum, expected, and maximum ages are represented by the green, orange, and red solid lines, respectively. The red circle represents the position of AF Lep b on this diagram. The error bar in separation is too small to be shown. The two vertical black dashed lines represent the position of the external belt of the debris disk hosted by AF Lep.
Current usage metrics show cumulative count of Article Views (full-text article views including HTML views, PDF and ePub downloads, according to the available data) and Abstracts Views on Vision4Press platform.
Data correspond to usage on the plateform after 2015. The current usage metrics is available 48-96 hours after online publication and is updated daily on week days.
Initial download of the metrics may take a while.