Fig. 5
Download original image
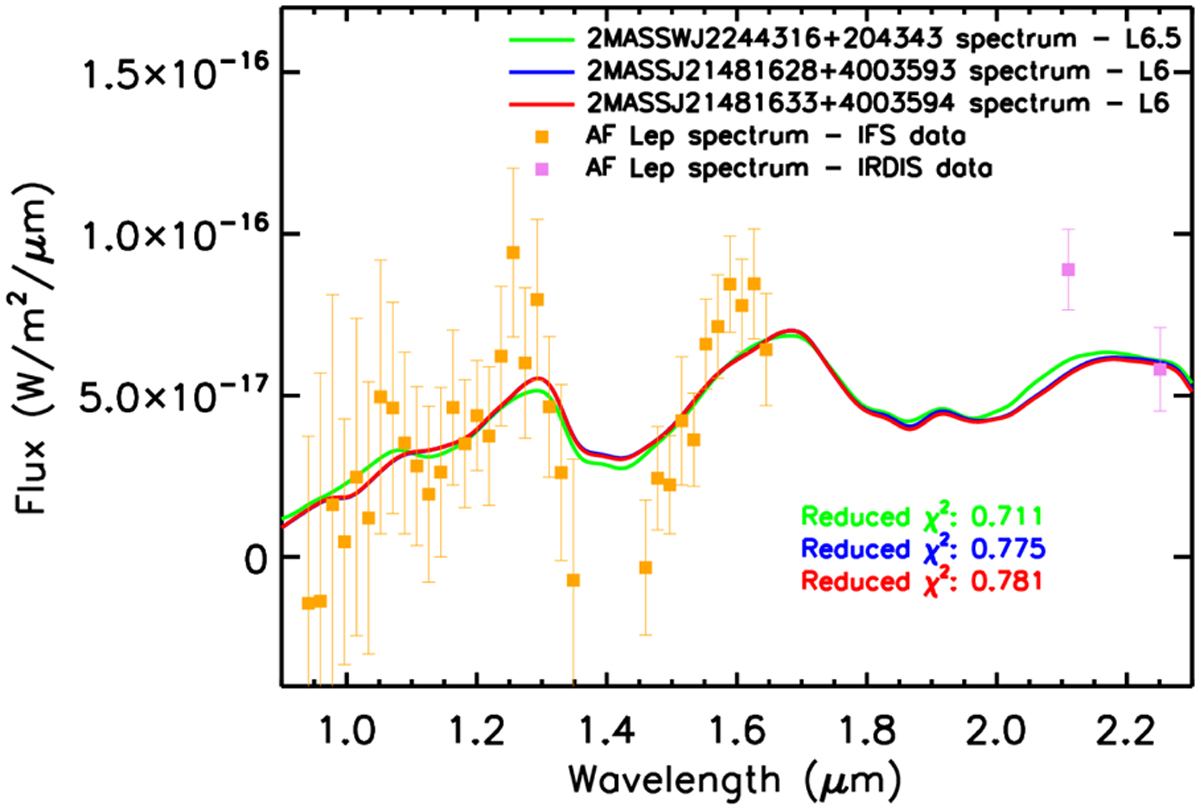
Comparison of the extracted spectrum of AF Lep b with the three best-fit template spectra from the SpexPrism spectral library. The IFS data points are orange squares, while the IRDIS data points are violet squares. The best three template spectra are represented by the green, blue, and red solid lines; they partially overlap with each other. The reduced χ2 for each template spectrum is reported with the corresponding color.
Current usage metrics show cumulative count of Article Views (full-text article views including HTML views, PDF and ePub downloads, according to the available data) and Abstracts Views on Vision4Press platform.
Data correspond to usage on the plateform after 2015. The current usage metrics is available 48-96 hours after online publication and is updated daily on week days.
Initial download of the metrics may take a while.