Fig. 3
Download original image
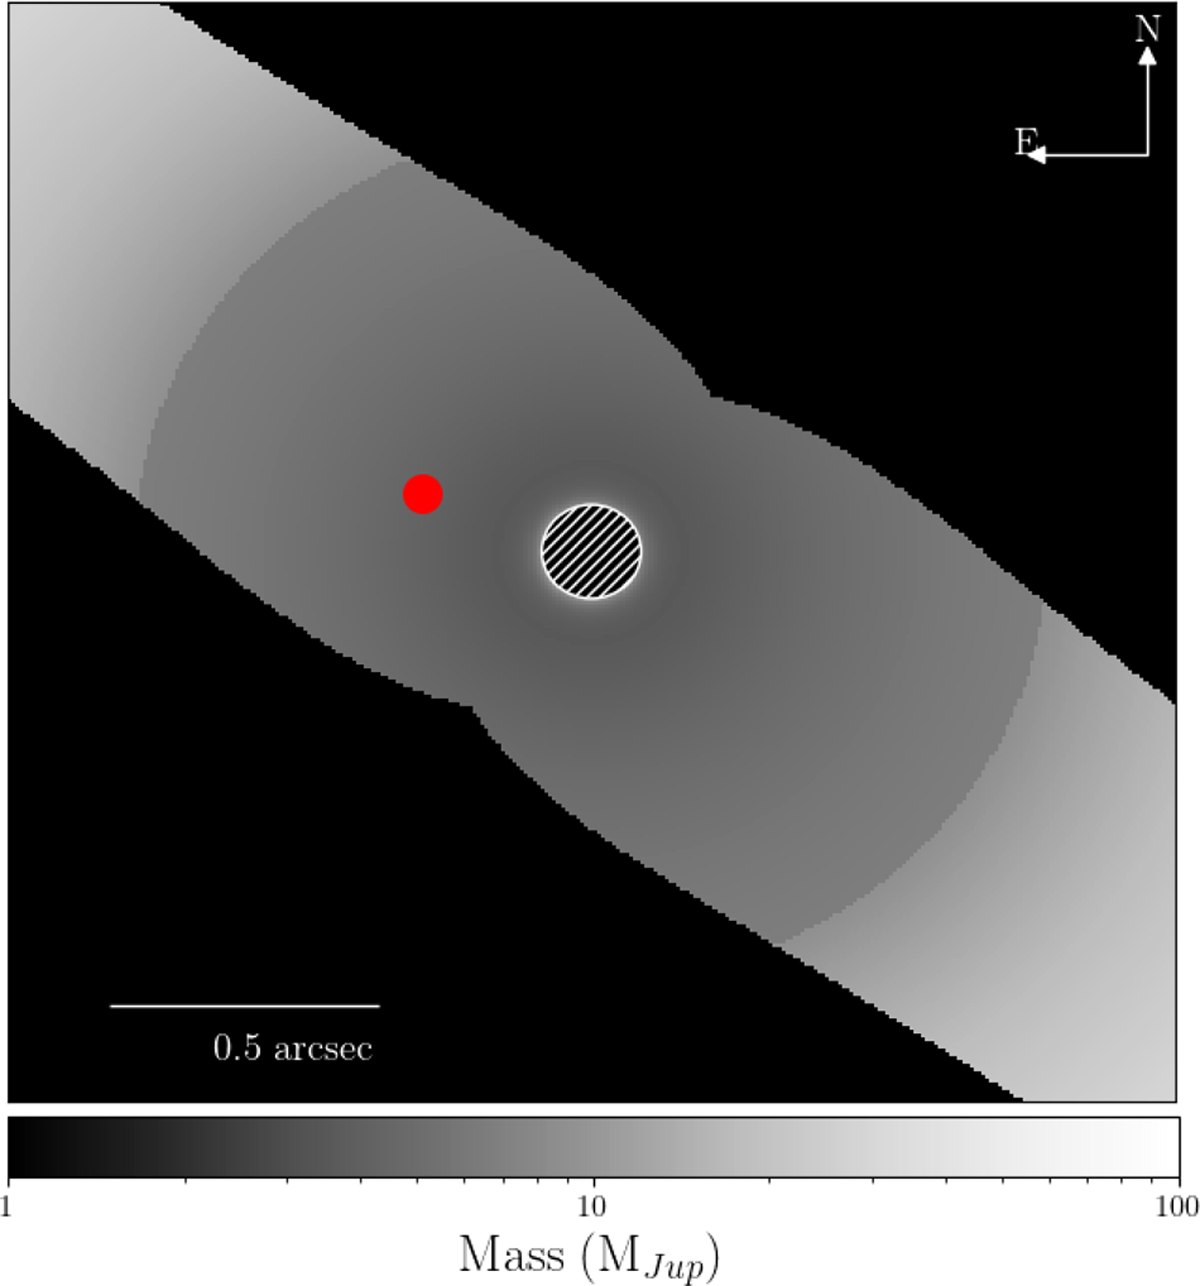
Two-dimensional maps obtained with FORECAST, showing the sky area compatible with the PMa reported in Table 1 in gray. The intensity of the gray areas changes according to the dynamical mass (in MJup) responsible for the PMa at a given distance, with the scale given by the lower color bar. The position of AF Lep b for the first SPHERE epoch is shown as a red circle. We do not plot the position of the companion in the second epoch in order to avoid overlapping between the two positions.
Current usage metrics show cumulative count of Article Views (full-text article views including HTML views, PDF and ePub downloads, according to the available data) and Abstracts Views on Vision4Press platform.
Data correspond to usage on the plateform after 2015. The current usage metrics is available 48-96 hours after online publication and is updated daily on week days.
Initial download of the metrics may take a while.