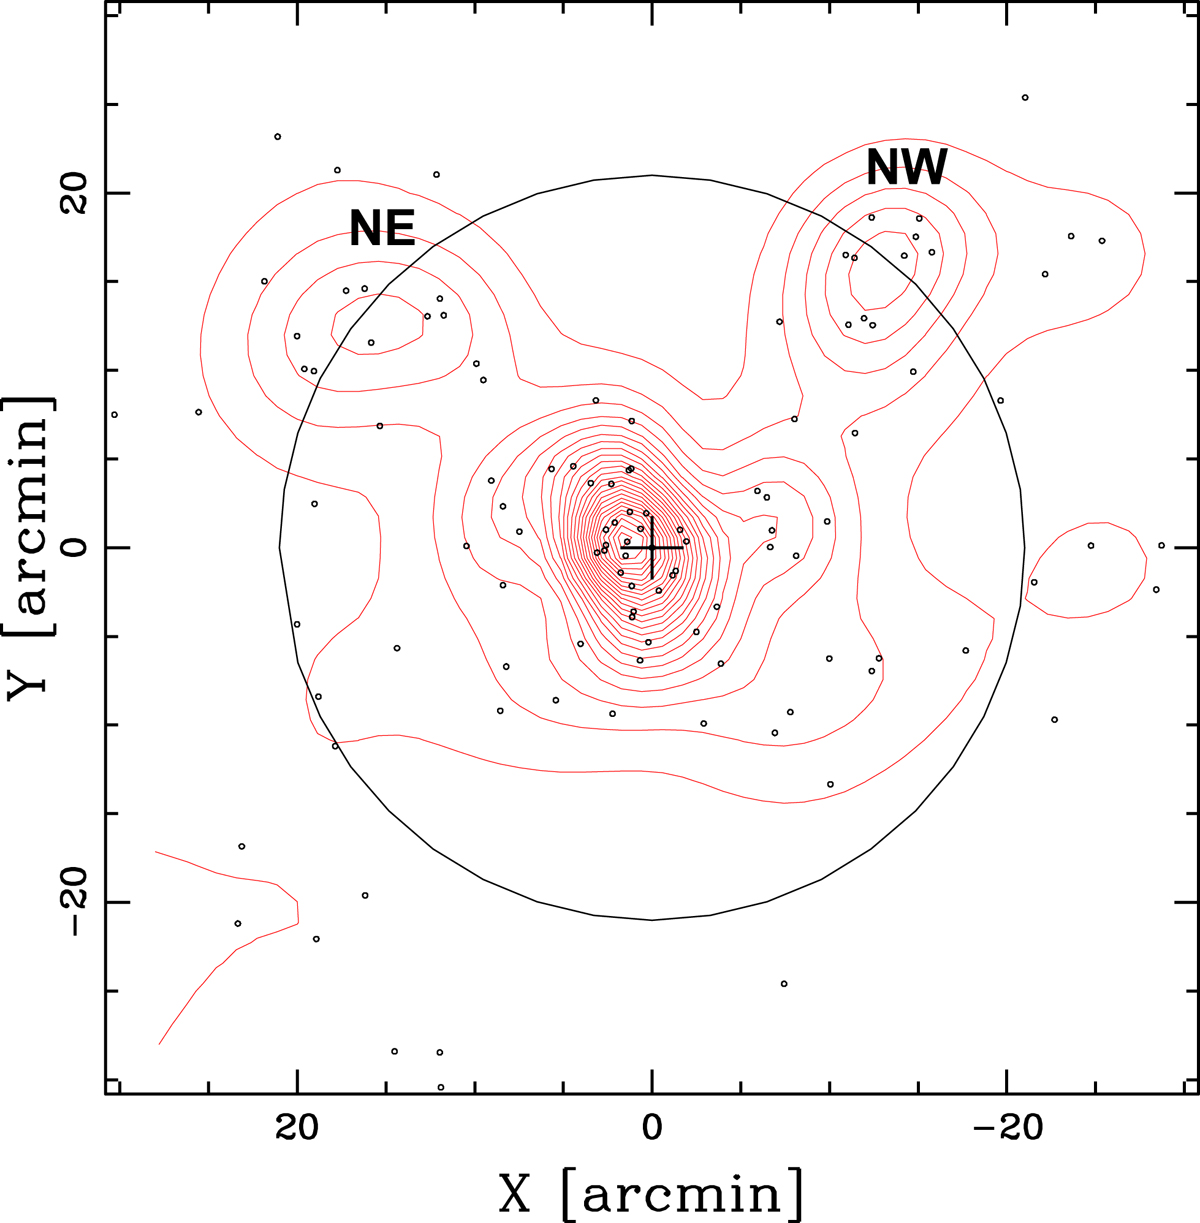
Fig. 5.

Download original image
Spatial distribution in the plane of the sky of the cluster members (black dots) with the corresponding isodensity contour map obtained with the 2D–DEDICA method (red contours). The black cross shows the position of the BCG, which is considered to be the center of A1213. The diagram is centered on the center of the cluster. A circle with a radius of 21′, i.e., approximately R200, is drawn. The labels refer to the two peripheral 2D–DEDICA peaks listed in Table 3.
Current usage metrics show cumulative count of Article Views (full-text article views including HTML views, PDF and ePub downloads, according to the available data) and Abstracts Views on Vision4Press platform.
Data correspond to usage on the plateform after 2015. The current usage metrics is available 48-96 hours after online publication and is updated daily on week days.
Initial download of the metrics may take a while.


