Fig. 3.

Download original image
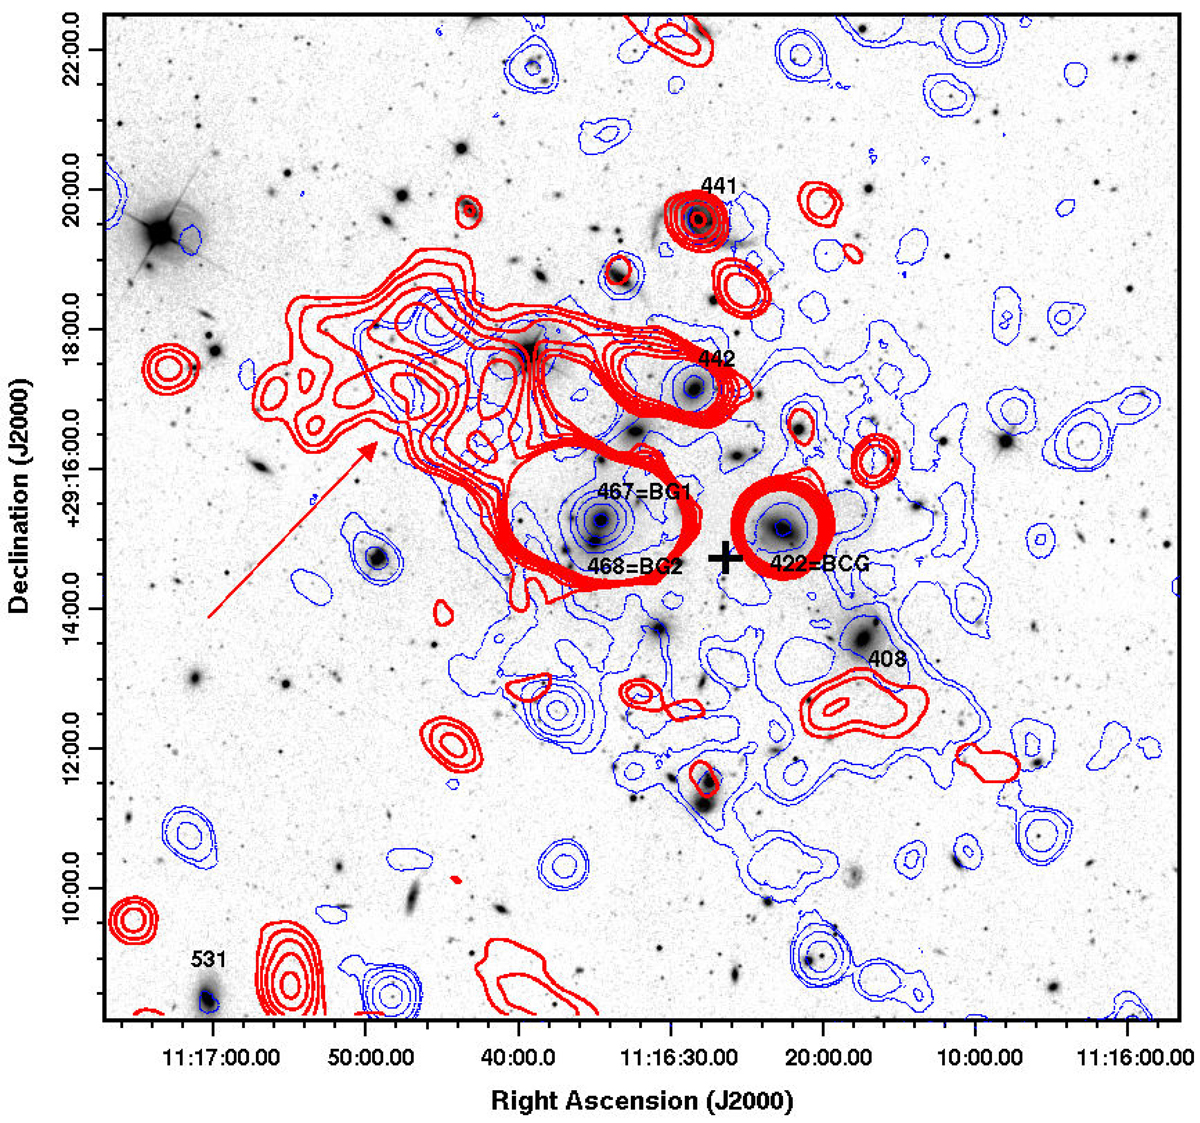
SDSS g-band image of the galaxy cluster A1213 with, superimposed, the contour levels of the VLA 1.4 GHz radio image by G09 (red thick contours, HPBW = 35″ × 35″, first contour level at 1 mJy beam−1, the others spaced by a factor ![]() ). Thin blue contours show the (smoothed) X-ray emission of the cluster as derived from the XMM-Newton archival image ID 0550270101 (photons in the energy range 0.7−1.2 keV). Labels denote galaxies discussed in the text. The arrow highlights the diffuse radio emission classified by G09 as a small-size radio halo. The black cross shows the position of the centroid of the X-ray emission (see Sect. 6).
). Thin blue contours show the (smoothed) X-ray emission of the cluster as derived from the XMM-Newton archival image ID 0550270101 (photons in the energy range 0.7−1.2 keV). Labels denote galaxies discussed in the text. The arrow highlights the diffuse radio emission classified by G09 as a small-size radio halo. The black cross shows the position of the centroid of the X-ray emission (see Sect. 6).
Current usage metrics show cumulative count of Article Views (full-text article views including HTML views, PDF and ePub downloads, according to the available data) and Abstracts Views on Vision4Press platform.
Data correspond to usage on the plateform after 2015. The current usage metrics is available 48-96 hours after online publication and is updated daily on week days.
Initial download of the metrics may take a while.


