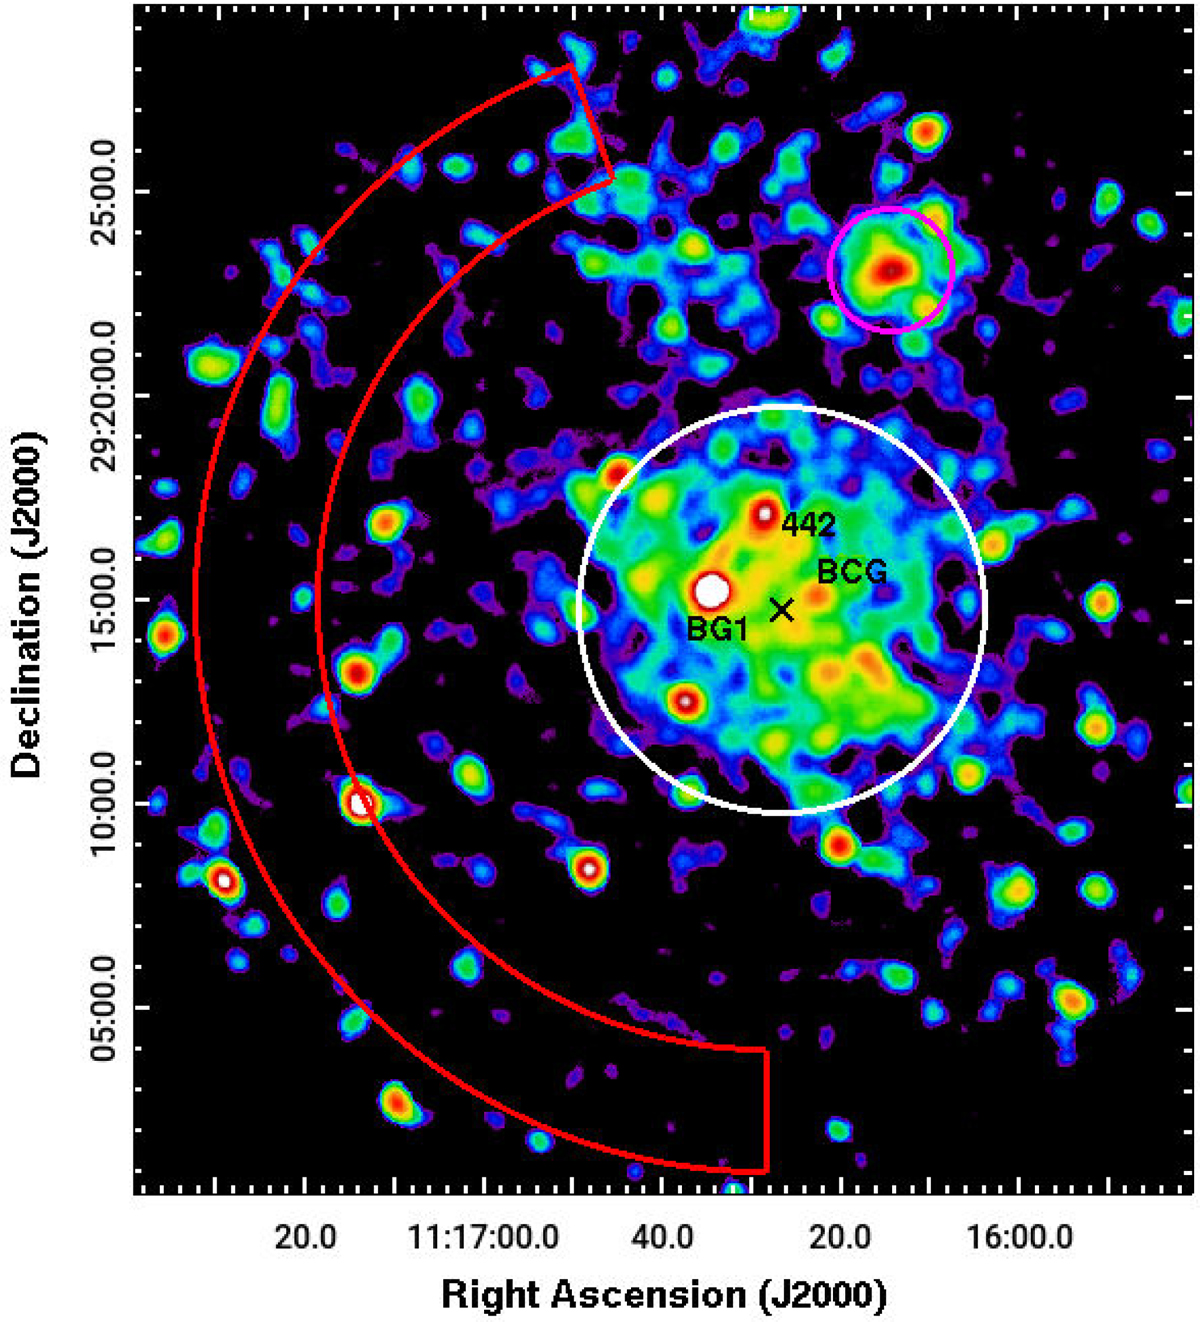
Fig. 11.

Download original image
Smoothed, vignetting-corrected XMM-Newton/EPIC count-rate image of A1213 in the 0.7−1.2 keV band. The circles show the regions used to estimate the global X-ray properties of A1213 (white) and of the extended source located NNW of the cluster (magenta, see text). Instead, the red region was used to estimate the local background components. The black cross marks the centroid of the X-ray emission. Black labels highlight galaxies that are also X-ray point sources.
Current usage metrics show cumulative count of Article Views (full-text article views including HTML views, PDF and ePub downloads, according to the available data) and Abstracts Views on Vision4Press platform.
Data correspond to usage on the plateform after 2015. The current usage metrics is available 48-96 hours after online publication and is updated daily on week days.
Initial download of the metrics may take a while.


