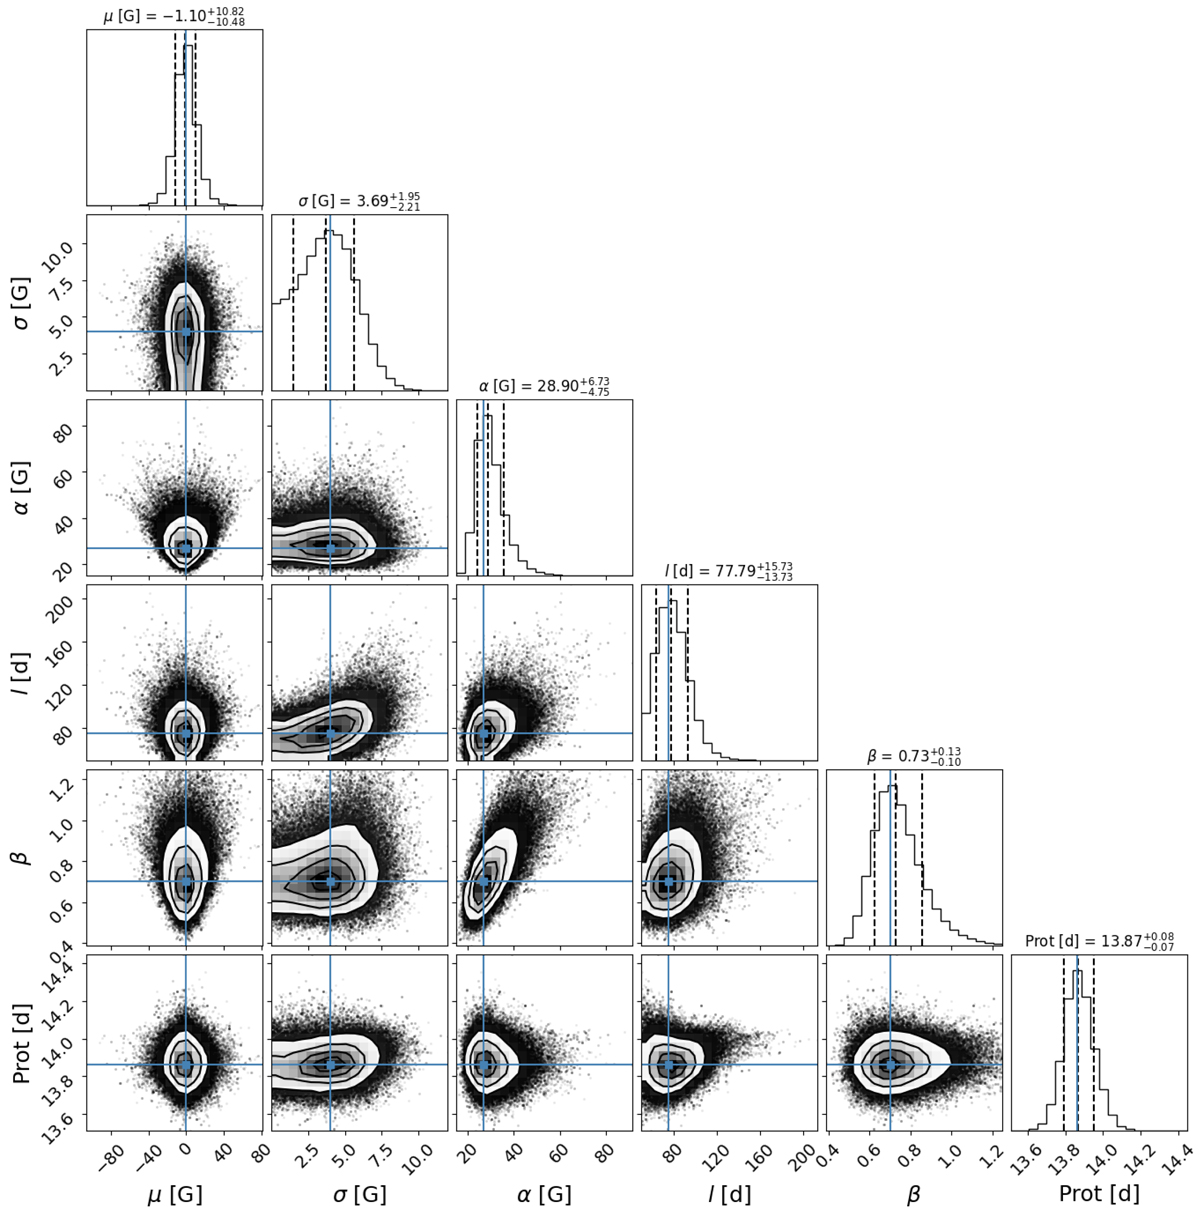
Fig. 8.
Download original image
MCMC samples and the posterior distributions of parameters in the quasi-periodic GP analysis of the stellar activity in the SPIRou Bℓ data of Gl 410. The blue crosses mark the mode of the distribution, and the vertical dashed lines in the histograms indicate the median and the 16 and 84 percentiles of the posterior PDF. The shaded regions correspond to uncertainties of 1, 2, and 3 σ in order of increasing radius.
Current usage metrics show cumulative count of Article Views (full-text article views including HTML views, PDF and ePub downloads, according to the available data) and Abstracts Views on Vision4Press platform.
Data correspond to usage on the plateform after 2015. The current usage metrics is available 48-96 hours after online publication and is updated daily on week days.
Initial download of the metrics may take a while.