Open Access
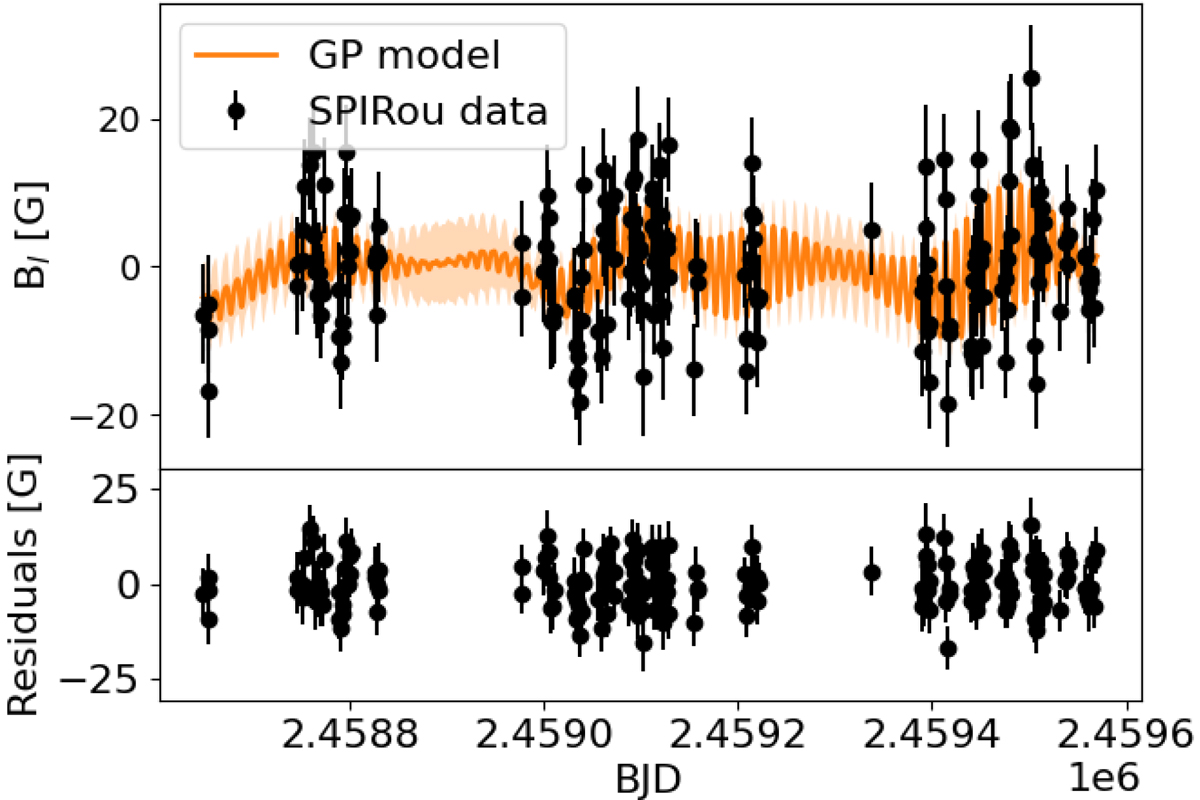
Fig. A.1.
Download original image
GP analysis of the SPIRou Bℓ data of Gl 846. The top panel shows the observed Bℓ data (black points) and the orange line shows the best-fit quasi-periodic GP model. The bottom panel shows the residuals.
Current usage metrics show cumulative count of Article Views (full-text article views including HTML views, PDF and ePub downloads, according to the available data) and Abstracts Views on Vision4Press platform.
Data correspond to usage on the plateform after 2015. The current usage metrics is available 48-96 hours after online publication and is updated daily on week days.
Initial download of the metrics may take a while.