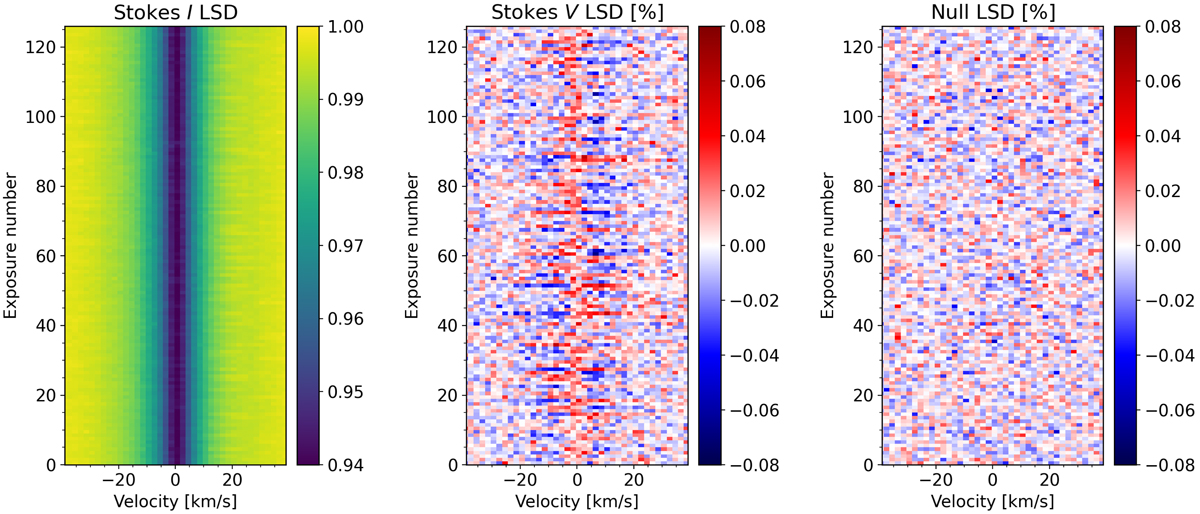
Fig. 1.
Download original image
Dynamical maps of Gl 410 constructed from individual observations (horizontal bands), stacked vertically. The first plot shows Stokes I LSD profiles, where the continuum is given in yellow and the different absorption depths are shown in green and blue shades. The following plots show the Stokes V and null LSD profiles, where positive values are given as red shades, and negative values are shown as blue shades. Note that Stokes V and null LSD amplitudes are expressed in percent. All plots are given in the rest frame of Gl 410 and display a velocity window of 10 FWHM (see Table 1).
Current usage metrics show cumulative count of Article Views (full-text article views including HTML views, PDF and ePub downloads, according to the available data) and Abstracts Views on Vision4Press platform.
Data correspond to usage on the plateform after 2015. The current usage metrics is available 48-96 hours after online publication and is updated daily on week days.
Initial download of the metrics may take a while.