Fig. 3
Download original image
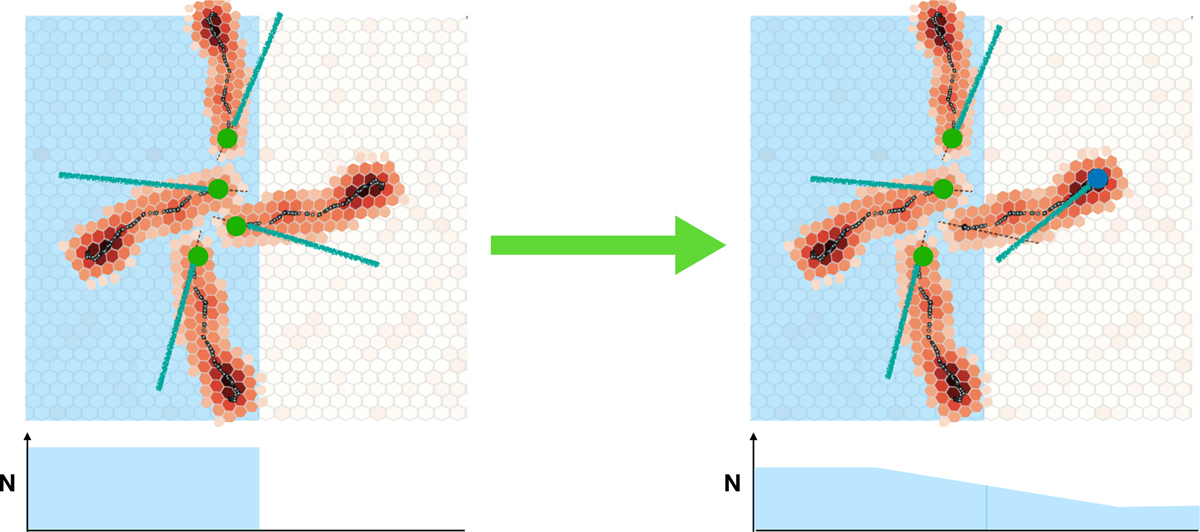
Schematic picture of polarization leakagefoг an unpolarized source with a sharp edge. The light-blue region represents the portion of the GPD corresponding to the source. Four events, close to the edge of the source image, are represented with their respective PE tracks. The green dots represent the true absorption points and the blue segments are the reconstructed polarization planes of the original photons. On the left, all absorption points are correctly reconstructed in their true positions: all events are inside the edge and none remain outside (bottom panel represents the event count); there are as many PEs with tracks tangential as orthogonal to the edge so no net polarization is assigned to the source. On the right the absorption point of the track extending outside the source edge has been wrongly reconstructed at the end of the track (blue dot): there are less events reconstructed inside the edge and more outside (bottom panel represents the event count); there are more PEs reconstructed with tracks tangential than orthogonal to the edge inside the source region, while there are PE events with tracks orthogonal to the edge outside. This leads to a blurring of the edge and to a polarization pattern tangential inside the edge and orthogonal outside.
Current usage metrics show cumulative count of Article Views (full-text article views including HTML views, PDF and ePub downloads, according to the available data) and Abstracts Views on Vision4Press platform.
Data correspond to usage on the plateform after 2015. The current usage metrics is available 48-96 hours after online publication and is updated daily on week days.
Initial download of the metrics may take a while.