Fig. 2
Download original image
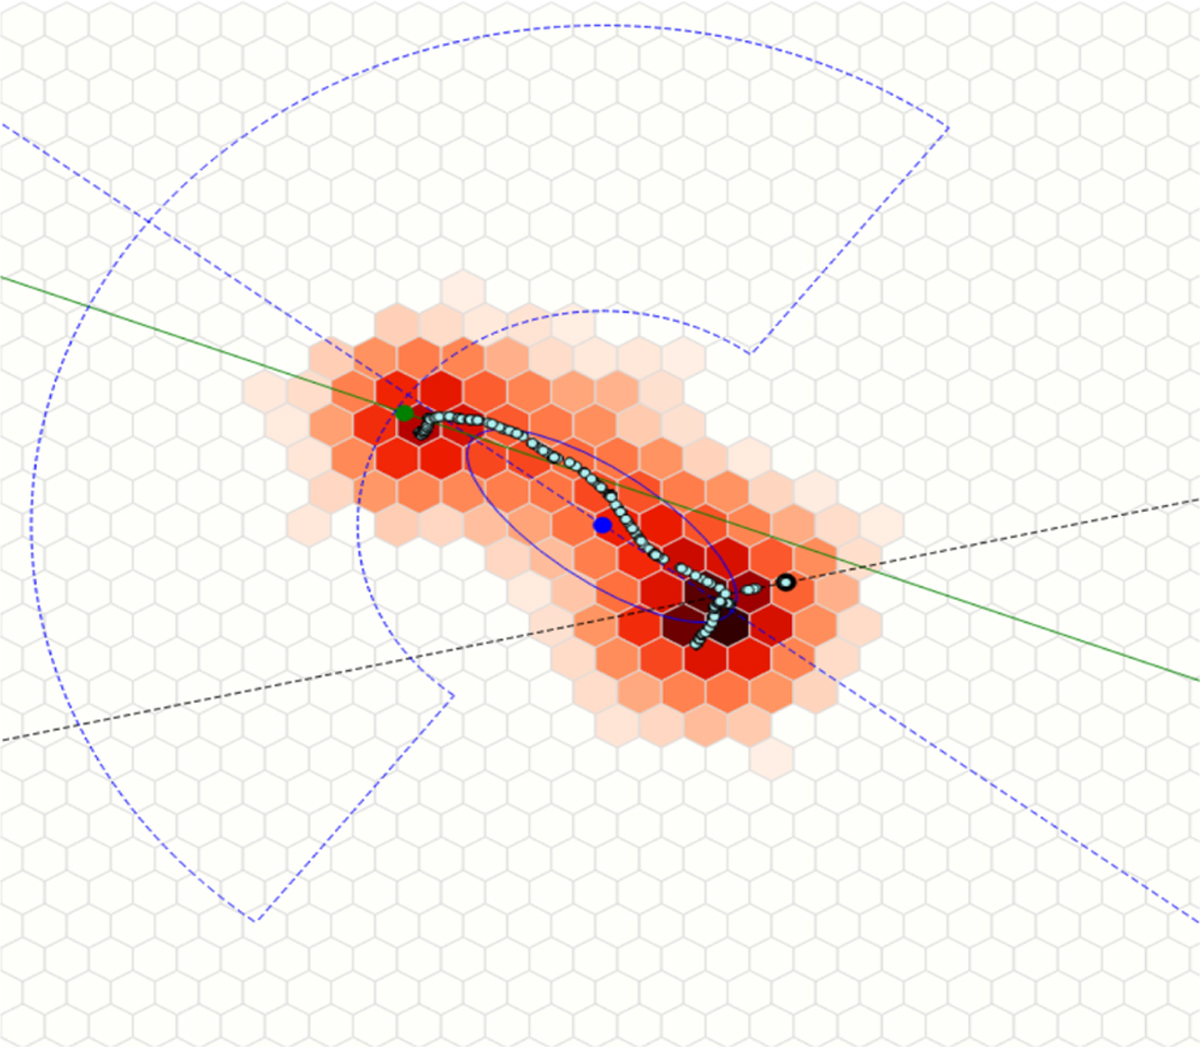
Example of a wrongly reconstructed absorption point. The black dot is the real absorption point, the green one is the reconstructed absorption point and the blue one is the barycenter. Note: the reconstructed polarization plane (blues dashed line) differs from the true one (black dashed line) Colors have the same meaning as in Fig. 1.
Current usage metrics show cumulative count of Article Views (full-text article views including HTML views, PDF and ePub downloads, according to the available data) and Abstracts Views on Vision4Press platform.
Data correspond to usage on the plateform after 2015. The current usage metrics is available 48-96 hours after online publication and is updated daily on week days.
Initial download of the metrics may take a while.